Figure 1, 6, 10 and 16 appear in Plate 14.
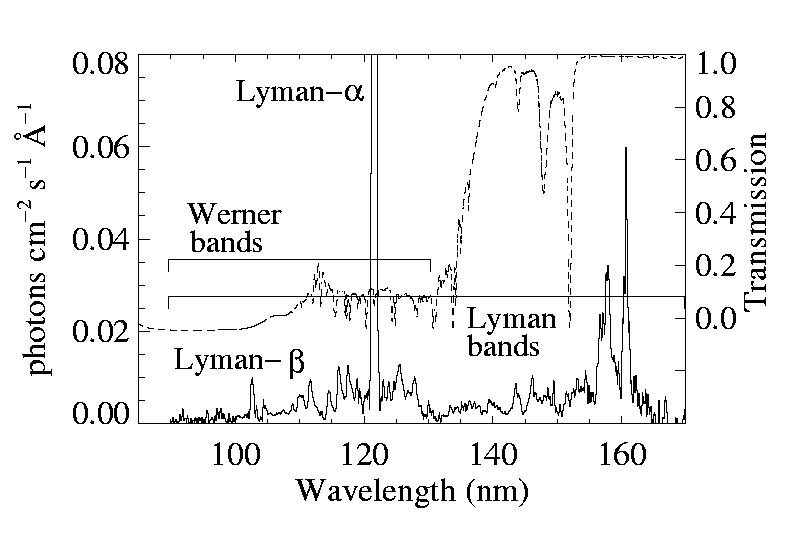
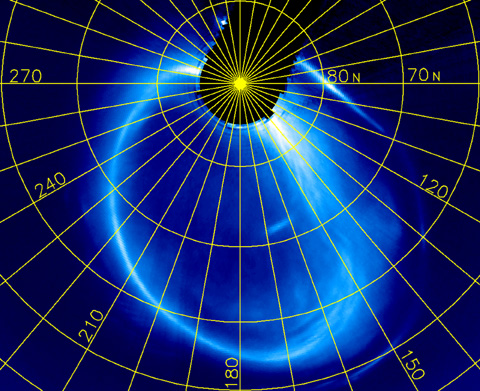
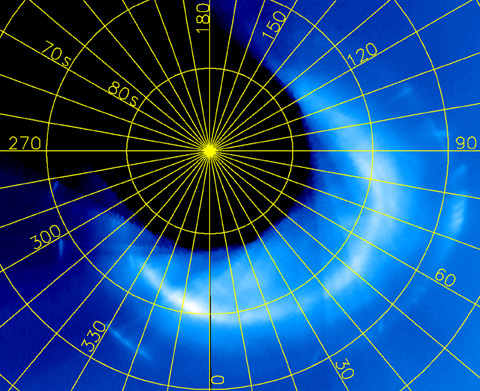
HST Auroral Movie - This movie (quicktime 15MB) file shows the sum of reduced and projected HST UV images of Jupiter's aurora from all days of the campaign in Dec. 2000 - Jan. 2001. The images shown here are all of the unfiltered accumulated images, which include the Lyman and Werner bands of H2 and H Ly alpha emissions from the disk and the aurora. The sky background has been subtracted from each frame, and dates and times in UT are indicated at the top of each frame.
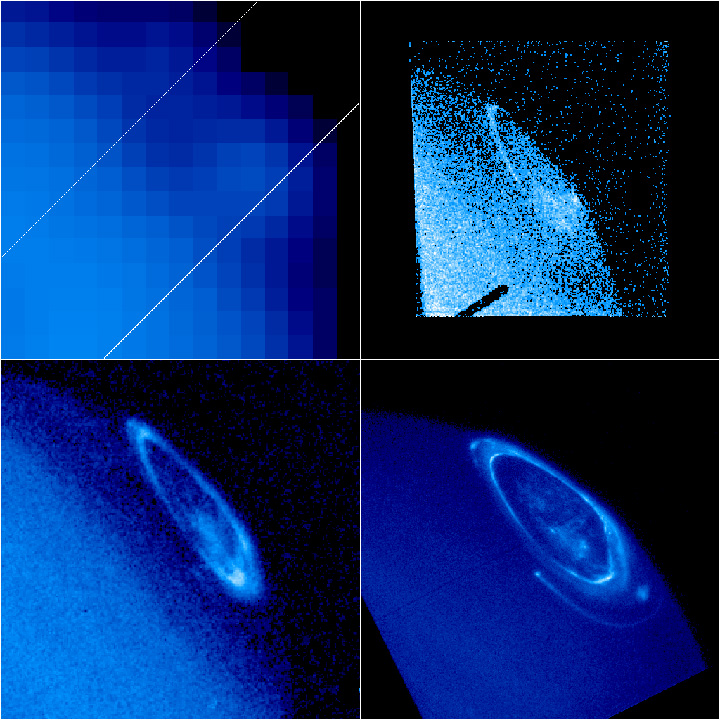
Each image has been projected to a view from above 180 deg. system III longitude and +30 deg. planetocentric latitude, so that one may see the relative changes in the auroral distribution and brightness without thedistraction of the planet's rotation. The blue portion of each frame is the projected image from that date and time, the red portion is the sum of all campaign images. On each day, the relative pointing on Jupiter is quite stable, while from day to day there may be small errors which appear as offsets of the auroral emissions. The fact that the overall summed image appears less sharp than the individual days suggests that these offsets may exist. The brightness scale is logarithmic in units of kRayleighs, with a maximum value of 1 MRayleigh.
_________________________________________________________________________
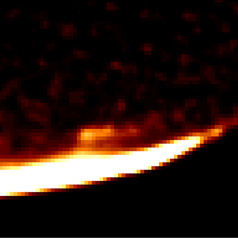
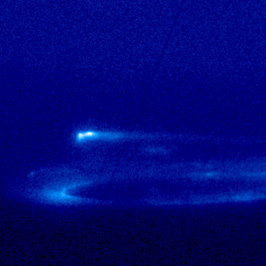
The following movie files show the raw data from HST STIS UV images of Jupiter's
aurora
for each day of the campaign in Dec. 2000 - Jan. 2001. These are a combination
of filtered and clear images, with the sky background subtracted from each
frame and the filtered images shifted and scaled up by a constant value to
match the disk brightness in the clear images. North pole images appear with
the polar region in the upper right of the frame, south in the lower left.
Series of accumulated images are represented here with the first frame in
the series, and time-tagged (filtered) images are summed for the whole period,
resulting in image smear from the planet rotation of approx. 3 degrees in
300 sec. Clear images are approx. 100 sec exposures. A summary of the observing
times and orbital longitudes of the main satellites follows:
| Date | UT | Jupiter CML | Io longitude | Europa longitude | Ganymede longitude | Callisto longitude |
| 14 Dec. 00 | 10:46-17:28 | 162-48 | 194-250 | 139-167 | 23-37 | 321-327 |
| 16 Dec. 00 | 11:00-17:41 | 111-355 | 243-297 | 345- 12 | 124-138 | 5- 11 |
| 18 Dec. 00 | 09:27-16:22 | 356-247 | 276-335 | 179-209 | 222-236 | 47- 53 |
| 28 Dec. 00 | 05:34-12:31 | 281-175 | 120-179 | 98-127 | 358- 12 | 259-265 |
| 13 Jan. 01 | 16:50-23:45 | 219-109 | 244-290 | 336-359 | 111-122 | 256-261 |
| 20 Jan. 01 | 12:41-19:44 | 42-297 | 181-241 | 302-332 | 91-106 | 44- 50 |
| 21 Jan. 01 | 16:00-23:02 | 313-207 | 53-112 | 57- 86 | 148-163 | 68- 74 |