The following color figures appear as B/W in the book - see below for remaining figures and tables.
Supplementary Materials
---------------------------------------------------------------------------
MacLowEntry.mpg Bolide Entering Jupiter's
Atmosphere
This animation represents Mac Low's simulation of a comet fragment one
kilometer in diameter plunging into Jupiter's atmosphere at 60 km/sec.
Color indicates density, with initial density of the comet core (red)
corresponding to solid ice. Pressure rapidly builds in front of the
comet from the aerodynamic force of impact with the atmosphere,
flattening the sphere and ripping it apart. The animation shows a
five-second time period, one frame every 0.025 seconds. This is a 2D,
axisymmetric model, with the symmetry axis horizontal and pressure
decreasing to the right.
Courtesy Mordecai-Mark Mac Low (American Museum of Natural History)
---------------------------------------------------------------------------
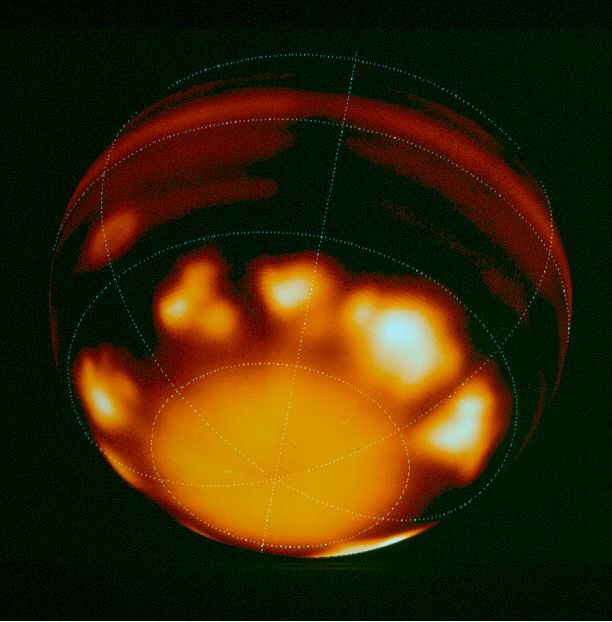
MacLowPlume.mpg Fireball on Jupiter
As the comet fragment enters Jupiter's atmosphere, the tremendous heat
generated incinerates it, and the resulting explosion releases energy
comparable to thousands of hydrogen bombs, with a fireball hundreds of
kilometers across. This animation shows initial stages of the
fireball, almost two minutes, with a frame every half-second. Image
height corresponds to 1,000 kilometers. Color represents temperature,
ranging from tens of thousands of degrees Kelvin (red), several times
the temperature of the sun, to hundreds of degrees Kelvin (blue).
This is a 2D, axisymmetric model, with the symmetry axis horizontal
and pressure decreasing to the right.
Courtesy Mordecai-Mark Mac Low (American Museum of Natural History)
---------------------------------------------------------------------------
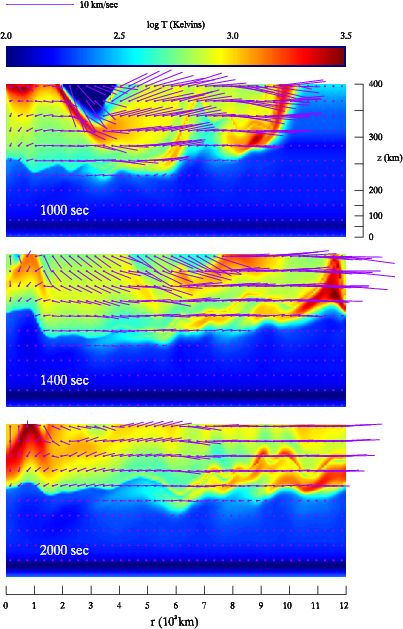
DemingSplash.mpg Plume Splashing Back
Onto Atmosphere
The ejected plume material re-enters the atmosphere at speeds up to 12
km/sec, sending shocks through the atmosphere. In this 2D model color
is temperature (Tmax = 3500 K) and anchored streamers show flow.
McGregor's ring shock is leaving the right edge of the grid, while the
vanguard makes its final re-entry near the origin in the 1000 sec
panel. The impact location is on the left edge and the right edge is
12,000 km away. The bottom is 1 bar pressure and the top is 400 km
up, but the scale is non-linear (see Plate 6 for scale).
Courtesy Drake Deming (NASA's Goddard Space Flight Center)
---------------------------------------------------------------------------
Original art for the book.
Book art converted to JPEG format.
Book art converted to JPEG at standard (reduced)
resolution.
LaTeX source code for the tables in the chapter.