Today’s Space Weather & Weather on Google Earth
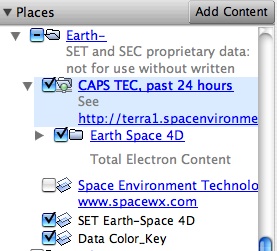
Download this KML file which is an animation of the past 24 hours Total Electron Content of the Ionosphere. Related files including Maximum Useable Frequencies (MUF) are available at the CAPS website, a joint effort between Space Environment Technologies and Space Environment Corporation.
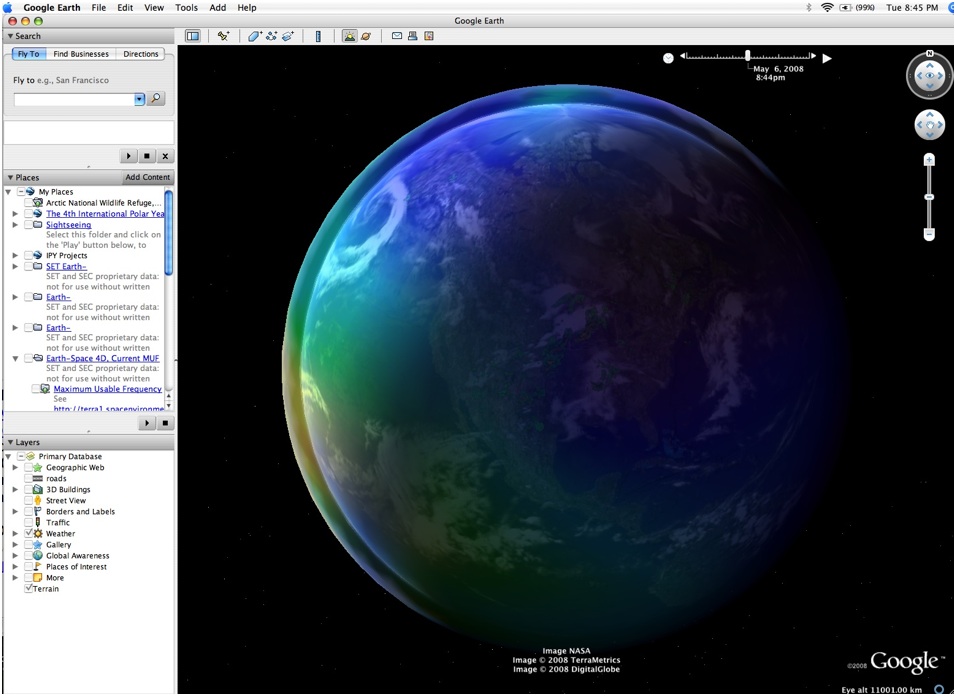
Once you have downloaded this file and opened it in Google Earth (ideally the new 6.0 version , which you can download here: http://earth.google.com/), you will be able to use the time slider in the upper left part of the screen to animate the file and see the changes in the ionosphere’s electron concentration.
Once you have downloaded the file, open the file and highlight it.
Learning Tips
Ionization caused by extreme ultraviolet energy and X-rays occurs in the upper reaches of the atmosphere. This energy doesn’t directly reach the Earth’s surface. Clouds and other manifestations of weather occur in the lower parts of the atmosphere. Short wave ultraviolet and visible light pass through the atmosphere and are absorbed at the Earth’s surface, heating it up. Long wave infrared energy radiated from the surface heats the lower atmosphere, as some of the energy is absorbed by “greenhouse gases.”
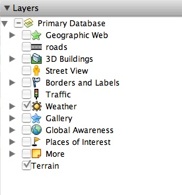
- Turn off all layers in the “Layers” side panel by unchecking the box next to ‘Primary Database’.
- Expand the Weather layer in the Layers side panel by clicking the + in the box to the left of the Weather layer.
- Turn on Clouds and Information by checking the box next to each.
- Double click the information layer, and select “download 24-hour clouds animation” in the balloon that opens in the GE display.
- Also select “Terrain” so you can see the land.
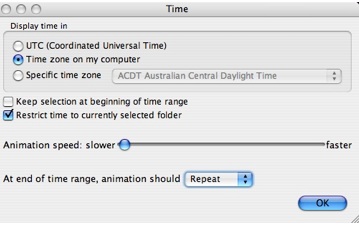
- Activate the timeline in the upper right part of the screen by clicking on the arrow on the right.
- If the timeline doesn’t properly represent the past 24 hour period, make sure all other animation layers are turned off in “My Places” or “Temporary Files”.
- Also, check the time display (accessed by selecting the button on the left side of the timeline slider bar ) to make sure the time is restricted to the currently selected folder.
Google Earth Assistance
Need a tutorial on Google Earth? Select here. There is also a special Google Earth site for educators.
Technical Notes:
TEC, or Total Electron Concentration of the ionosphere is “an indicator of the number of electrons that a radio signal must pass through. Maximum electron values are generally at the 200-300 km level and high TEC can indicate higher maximum altitudes with more densities,” meaning less high frequency (HF) radio propagation. Changes in the ionosphere can have a major impact on radio communications especially over polar regions.
For extra support contact Mark McCaffrey