
MinXSS Science Nugget 3
Validation of GOES-15 XRS-B Irradiances with MinXSS X123
2017 June 3
Tom Woods and the MinXSS Science Team
As follow up on MinXSS nugget #1, the MinXSS soft X-ray (SXR) spectra from the Amptek X123 SXR spectrometer have provided a new validation for the GOES-15 X-Ray Sensor (XRS) calibration as presented in Woods et al. [2017]. The comparisons of the reported irradiance from GOES XRS and the irradiance obtained by integrating the X123 spectra from 1 to 8 Å are shown in Figure 1, along with a suggested new calibration function for the GOES-15 XRS-B channel. The previous recommendation by the NOAA Space Weather Prediction Center (SWPC) for the GOES XRS-B calibration is that the XRS-B band reported values need to be multiplied by 1.43 (divided by 0.70) to convert from flare levels (e.g., C, M, X) to physical irradiance units of W m-2. (see http://ngdc.noaa.gov/stp/satellite/goes/doc/GOES_XRS_readme.pdf ). The true corrections for the GOES XRS reported irradiances are not expected to be a simple scalar factor applicable to all flare phases and magnitudes because the GOES XRS irradiance data processing is based on an assumed flat solar spectrum, while the true solar spectrum is known to vary during and between flares. In other words, the SXR spectral distribution changes dramatically as the coronal temperature changes, so the scaling of the irradiance for a broadband SXR photometer will vary with the assumed SXR spectrum (itself dependent on an assumed coronal plasma temperature, density and abundance). This comparison indeed confirms that the correction for the GOES XRS flare levels to physical irradiance units is a function of the flare level.
Figure 1A shows the time series comparison that indicates higher values for the X123 integrated irradiance than for the reported XRS-B values during flares and much lower irradiance for quiescent activity. The GOES XRS and X123 data are both plotted with 1-min cadence. The GOES XRS data have no gaps. The X123 data have several gaps during the ~30-min eclipse period every orbit and on a few days when recovering from spacecraft anomalies
Figure 1B shows the ratio of the X123 integrated irradiance to the reported XRS-B irradiance versus the XRS-B level. As expected, this ratio is not a constant value at the low levels because the XRS background level correction is a constant instead of a time-varying correction and at the higher levels because the coronal temperature is changing with the SXR variability as illustrated in Figure 1C. The flattening of this irradiance ratio above about C5 is likely related to the hot component becoming completely dominant in the 1–8 Å range as seen by both instruments, compared to the cooler few-MK “ambient” component that X123 clearly sees but which is at the limit of the GOES XRS-B temperature response.
The X123 dominant hot temperature component is plotted in this Panel 1C along with the estimated temperature derived using the ratio of the GOES XRS-A (0.5–4 Å) to XRS-B intensities. The GOES-derived temperature deviates from the X123-derived temperature below the B7 level; this is related to the XRS-A signal approaching its signal floor and then forcing a bias towards a hotter temperature. In other words, the XRS-A signal is not accurate at the lower levels, thus the temperature derived with the ratio of XRS-A to XRS-B is not accurate below the B7 level. The X123-derived temperature trend, the green line in Figure 1C, does not have this limitation, and it indicates a temperature transition from a non-flare temperature of 1.8 MK below the B2 intensity to the hot corona flare temperature that reaches ~12 MK around the M1 intensity. There are only a few X123 results above M1, so the appearance of flattening at ~12 MK may not be realistic. Instead the temperature trend likely continues upward for higher GOES classes.
The suggested calibration function for scaling the reported GOES XRS-B flare levels to obtain physical irradiance units is provided in Figure 1B. This function is almost a constant value of about 1.5 for above the C1 level, consistent with the prior SWPC analysis of the GOES calibration. This function deviates to a smaller factor below the C1 level and is about a factor of one at the B2 level where the temperature is estimated to be 2 MK (Figure 1C). This calibration function is valid over the measured intensity range of A5 to M2. From initial analysis by NOAA SWPC, this ratio of X123 to XRS-B will be flatter when a revised time-dependent background correction is applied to the XRS-B data. We suggest a constant factor of 1.5 could be used for flare magnitudes above M2. The uncertainty for this calibration function (fitted ratio) is estimated to be 0.15 (or 12% as relative uncertainty) based on the function fit (5%) and X123 pre-flight calibration (10%) uncertainties.
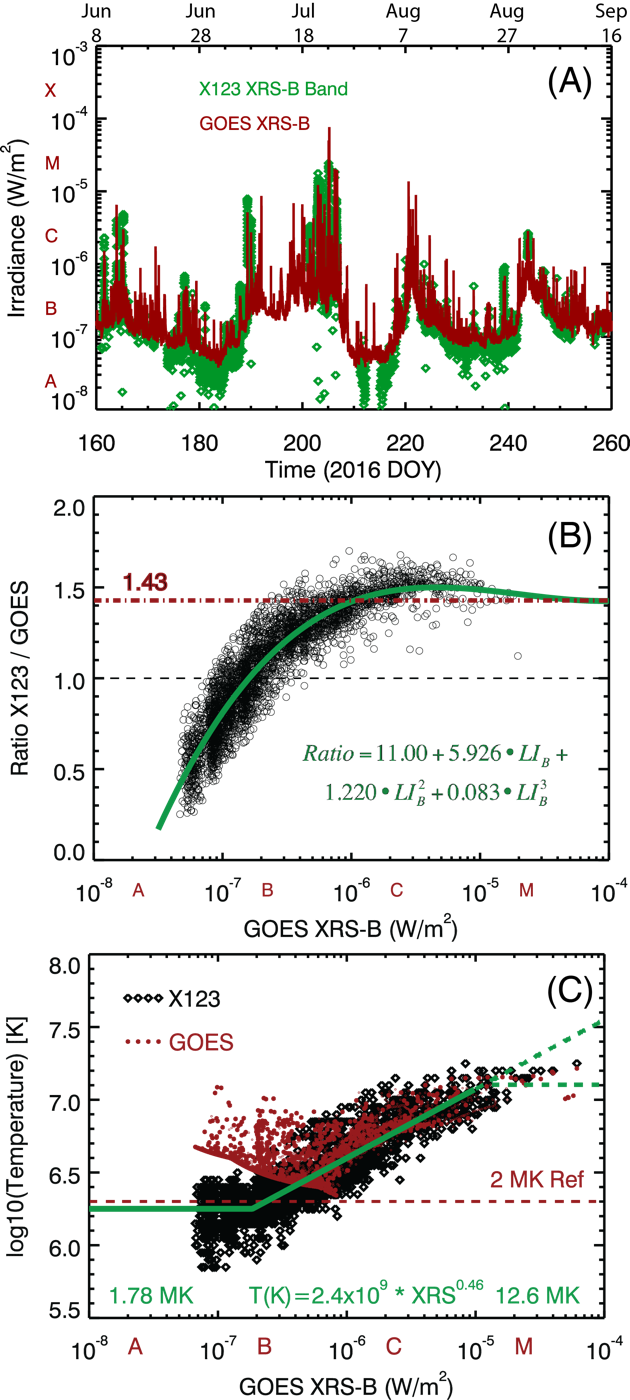
Figure 1. Comparison of GOES XRS with MinXSS data. (A) The MinXSS X123 spectra integrated over the 1–8 Å band (green) is compared to the GOES XRS-B band on its reported scale (red). (B) The ratio of this X123 integrated band to GOES XRS-B is plotted as function of XRS intensity. The red dot-dash line at 1.43 is the NOAA previous irradiance conversion factor for GOES XRS-B. Suggestion for new calibration for GOES XRS-B is shown as the green line with the function parameters listed in panel B with LI being the log10(GOES XRS-B). This calibration function is valid over the intensity range of A5 to M2. (C) The temperature estimated as a function of GOES XRS-B intensity. The black diamonds are the hot temperature component for the MinXSS SXR spectra, and the red dots are the temperature derived from the GOES XRS two bands. Temperature trend fits are shown as the solid green lines, and possibilities for the temperature trend for above the M1 level are shown as the dashed green lines. This is Figure 4 in Woods et al. [2017].
References
Woods, T. N., A. Caspi, P. C. Chamberlin, A. Jones, R. Kohnert, J. P. Mason, C. S. Moore, S. Palo, C. Rouleau, S. C. Solomon, J. Machol, and R. Viereck, New Solar Irradiance Measurements from the Miniature X-ray Solar Spectrometer CubeSat, Astrophys. J., 835, 122, doi:10.3847/1538-4357/835/2/122, 2017.
MinXSS project web site: https://lasp.colorado.edu/minxss/