
Observations of the Venus Transit – Total Irradiance
By Greg Kopp, LASP, Univ. of Colorado
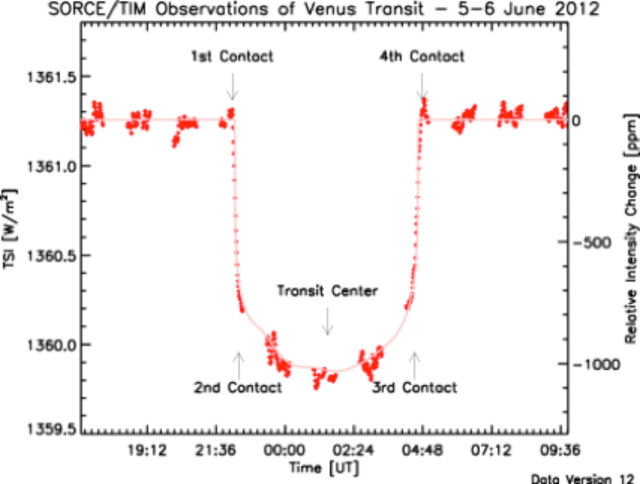
he Total Irradiance Monitor (TIM) on SORCE has a precision of approximately 0.0004%, or 4 parts per million (ppm), so it can detect very small fluctuations in the Sun’s spatially-integrated radiant output as needed for monitoring long-term solar variability. With this extremely high level of sensitivity, normal solar fluctuations over a few minutes of ~50 ppm due to solar convection and oscillations are readily apparent, as are larger (~1000 ppm), longer-duration changes due to sunspots and faculae.
The 5-6 June 2012 Venus transit was therefore unmistakable in the plotted TIM measurements (red dots). In excellent agreement with predictions (faint red curve) based on the positions of SORCE, Venus, and the Sun, the incident sunlight decreased by 1000 ppm during the transit, making it comparable to a medium sized sunspot. The plotted TIM’s total solar irradiance data show a decrease from the Sun’s current normal value of 1361.25 W/m2 down to 1359.85 W/m2 at the center of the 6 hr 37 minute transit. The decreasing brightness nearer transit center is due to the Sun being brighter near disk center than at the edges, thus meaning Venus blocks out more light when nearer disk center. This limb darkening effect was included in the predicted light curve in the plot. The aforementioned small fluctuations in solar brightness on short time scales from solar convection and oscillations can be seen in measurements both before and after the transit. Gaps in the shown data are from times when the SORCE spacecraft was in the Earth’s shadow and could not view the Sun; great (albeit slightly fortuitous) planning on the part of SORCE Mission Operations meant that all four contacts for this rare Venus transit were observed!
Exo-solar planets are being discovered via transits in front of their stars using similar light curve measurements. While Venus shows a 1000 ppm decrease when transiting the Sun as viewed from the Earth’s relatively close vantage point, when viewed from another star system this Venus transit – or that of any Earth-like planet – would appear as a mere 80 ppm decrease. Superposed on that signal are the previously mentioned solar fluctuations of ~50 ppm from which the transit must be distinguished; such are the difficulties that are being overcome by exo-solar planet discovery experiments such as NASA’s Kepler mission.
The shown TIM Venus transit plot and more details of Venus and Mercury transits viewed by the TIM can be found at http://spot.colorado.edu/~koppg/TSI.
SIM Sees Venus Transit
By Jerry Harder, LASP, Univ. of Colorado
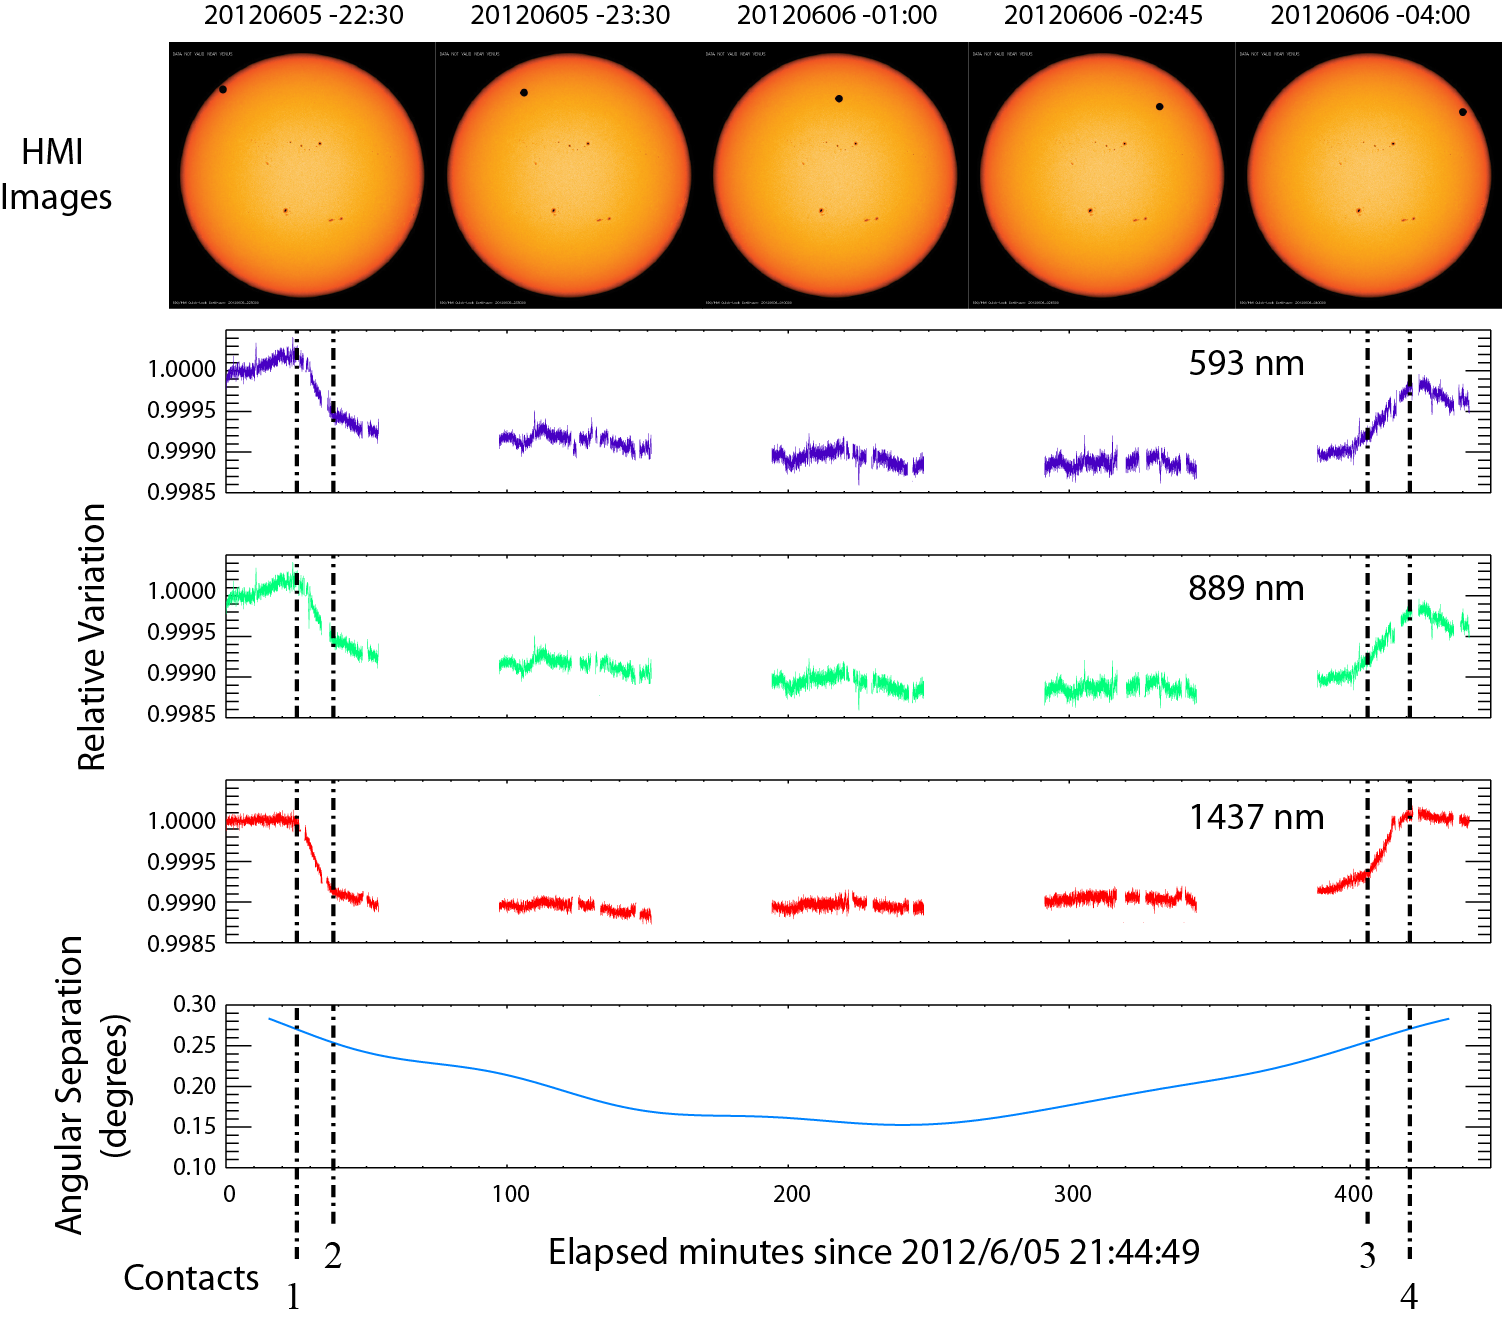 SIM A observed the Venus transit in a fixed wavelength mode with the hard radiation trap in place to minimize prism degradation over the ~7.5 hour period of the transit. The position of the instrument’s prism drive was selected so the Vis1, Vis2, and IR photodiodes can record the event simultaneously. Because the SIM instrument is now in a power cycling mode to conserve power, additional temperature corrections were applied to remove any thermal bias in the time series. All four Venus-Sun contact points were observed at 593 nm (Vis1), 889 nm (Vis2), 1437 nm (IR) with a respective signal-to-noise ratio of 14400, 22900, 12000 per 0.1 second integration time; simple data smoothing, as seen in the plot, increases the SNR even further. For reference the Sun-Venus angular separation is shown in the bottom plot. The top panel shows the progression of Venus across the Sun as seen by the SDO HMI instrument. For more information about HMI, please see http://jsoc.stanford.edu/.