Electronic Appendix to Callisto Chapter 17
Moore et al. (1999) considered a vertical (~100-m-scale) icy scarp on
Callisto at midday, overlooking a horizontal plain covered in dark material,
and compared its energy balance with that of a hypothesized horizontal bright
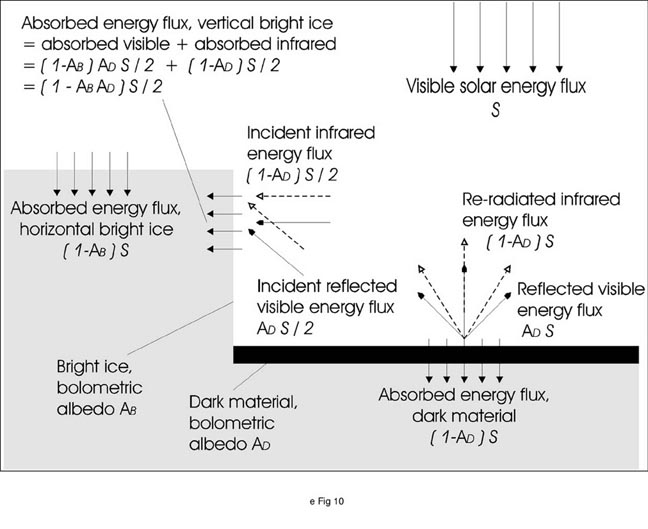
icy surface at the top of the scarp (eFigure 10). Here we summarize and elaborate
on that work. Moore et al.’s adoption of an idealized vertical
cliff was a simplification, designed to quantitatively evaluate scarp retreat
without resorting to a complex numerical treatment. They assumed unit emissivity
for all surfaces, Lambertian scattering of sunlight, isotropic emission of thermal
radiation, midday illumination geometry, and negligible thermal inertia for
the dark material (close to the real situation), so that absorbed solar radiation
is immediately re-radiated in the infrared.
With these assumptions, the upward energy flux from the dark material equals
the incident solar flux. Unlike the incident radiation, however, energy is re-radiated
isotropically into 2p steradians, a fraction (1-
Ad) of which is thermal IR radiation, where Ad is the dark material's
bolometric albedo. As seen from the vertical scarp of ice, the dark material
subtends a solid angle of p steradians. Thus the
incident visible and thermal energy flux onto the scarp is half that reflected
and radiated from the dark surface, or half the incident solar flux (note that
vertical surface, at midday, receives no direct insolation).
Because the horizontal top of the ice block receives the full incident solar
flux, it might seem that it would be warmer than the vertical face, which receives
only half that flux. However, ice is a good reflector of visible radiation and
a good absorber of thermal IR radiation (e.g., Warren 1984). The assumption
of unit emissivity for the ice means that it absorbs all incident IR radiation
received from the dark material, while it absorbs only a fraction (1-Ab) of
the visible radiation, where Ab is the ice bolometric albedo. From eFigure 10,
the result is that the energy flux EV absorbed by the vertical face is,
EV = S/2 (1-[Ab x Ad]) (A1)
while the horizontal ice surface absorbs an energy flux
EH = S(1-A) (A2)
Putting in Ad = 0.15 and Ab = 0.7, the vertical face absorbs almost 50% more
energy than the horizontal face. If the thermal inertia is similar on the vertical
and horizontal ice surfaces, the vertical face will be warmer than the horizontal,
with a higher sublimation rate (note that diurnal sublimation is dominated by
high rates at peak, noontime temperatures). For a surface with many such bedrock
exposed scarps, there is a net transfer of H2O ice from the quasi-vertical scarps
to nearby horizontal ice surfaces of topographic high points (such as knob crests).
Slumping and debris falls further tend to maintain ice slope steepness. Some
trapping of heat in concavities at the base of a slope is expected, because
as in a crater interior, surfaces here see a large solid angle of surface that
can radiate to them, and a relatively small solid angle of deep space. The dark
material at the scarp base thus tends to be even warmer than more distant dark
material, and preferentially warms the nearby ice, volatilizing CO2 and H2O
thus tending to undermine the retreating scarp. The over-steepened scarp cannot
accumulate a lag deposit, so dark material released from the ice accumulates
at the base and is left behind as the scarp continues to retreat.
This process naturally accounts for the icy brightening of topographic crests
that are so conspicuous on Callisto: while scarps of exposed H2O
and CO2 ice-rich bedrock retreat, H2O being comparatively
less volatile once liberated, immediately accumulates as frost on nearby high
horizontal surfaces and a refractory lag accumulates below. The more volatile
CO2 ice, which makes up the topography supporting "cement"
of the bedrock, sublimes from the face of the scarp until mass-wasting caused
by oversteepening exposes fresh bedrock (Figure 24 in text). Since large debris
avalanches are more common on Callisto than on other icy Galilean satellites,
Callisto’s upper crust is more susceptible to sublimation-induced mechanical
weakening, undermining, and undercutting than that of the other icy Galilean
satellites.
Rates of scarp retreat and ground lowering depend critically on the albedo and
thermal inertia of the exposed surface, the depth through any lag to icy bedrock,
and the thermal inertia of that lag. These values are impossible to determine
precisely; but Moore et al. (1999) modeled the rate of sublimation for
various materials through a loose, low thermal inertia, volatile-depleted material.
Fig. 25 (in text) shows their results when the dark material has a thermal skin
depth of ~10 cm. Even H2O sublimates at rates sufficient to visibly alter landforms
at SSI resolutions if it is close to “hot” dust. However, a dust
cover of just a few tens of centimeters can suppress sublimation of all candidate
volatiles except CO2. Moore et al. (1999) concluded that the widespread
degradation of Callisto’s landforms implies that CO is a significant
component of the relief-supporting ices in the upper crust. The discovery of
a tenuous CO2 atmosphere (Carlson 1999) supports their conclusion.
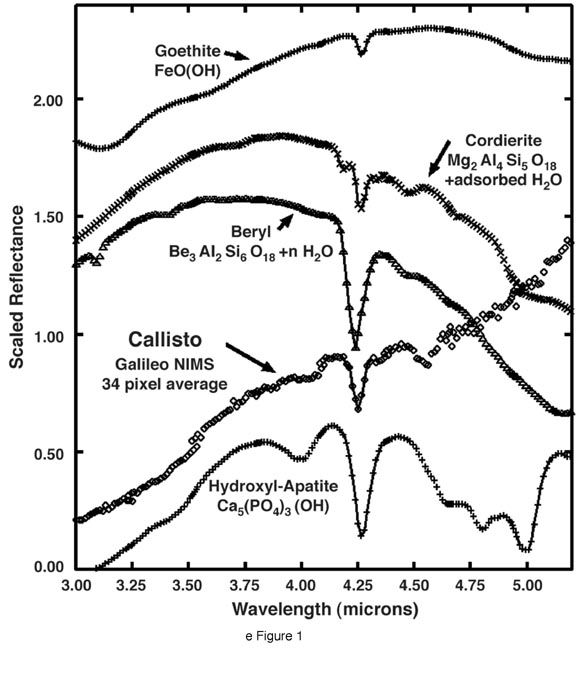
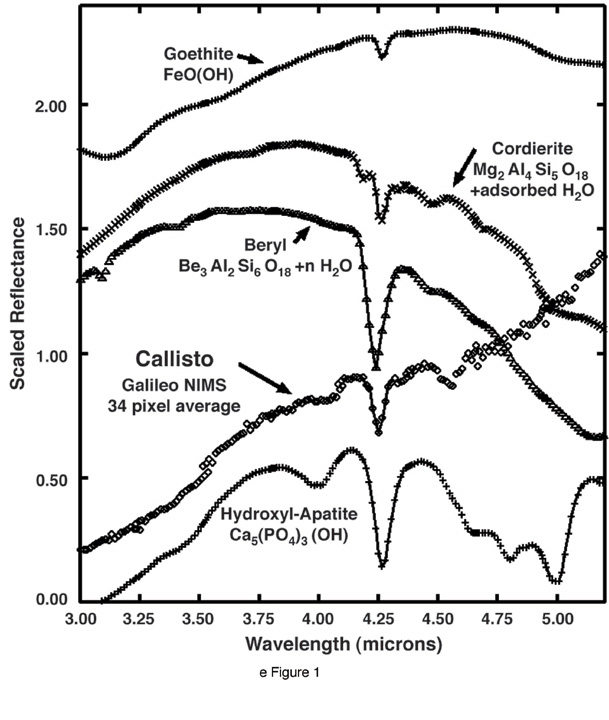
eFigure 1 A spectrum of Callisto is shown along with diverse minerals whose spectra show similar absorption bands, and have CO2 gaseous or fliud inclusions. Each spectrum is convolved to the Callisto NIMS spectral sampling and bandwidth, scaled to 1.0 near the 4.25 µm CO2 band for best comparison, then offset on the plot for clarity. Hydroxyl-apatite was offset -0.4, goethite +1.25, cordierite +0.8, and beryl + 0.5. The diversity in mineralogy, from adsorbed water, trapped water (beryl), hydroxyl bearing oxides (goethite), to phosphates (hydroxyl-apatite) illustrates how common this absorption is in minerals. It is seen in many other minerals, with varying strengths, some of which may be due to water/OH abundance. The position varies and might be diagnostic once we learn more about these absorptions.
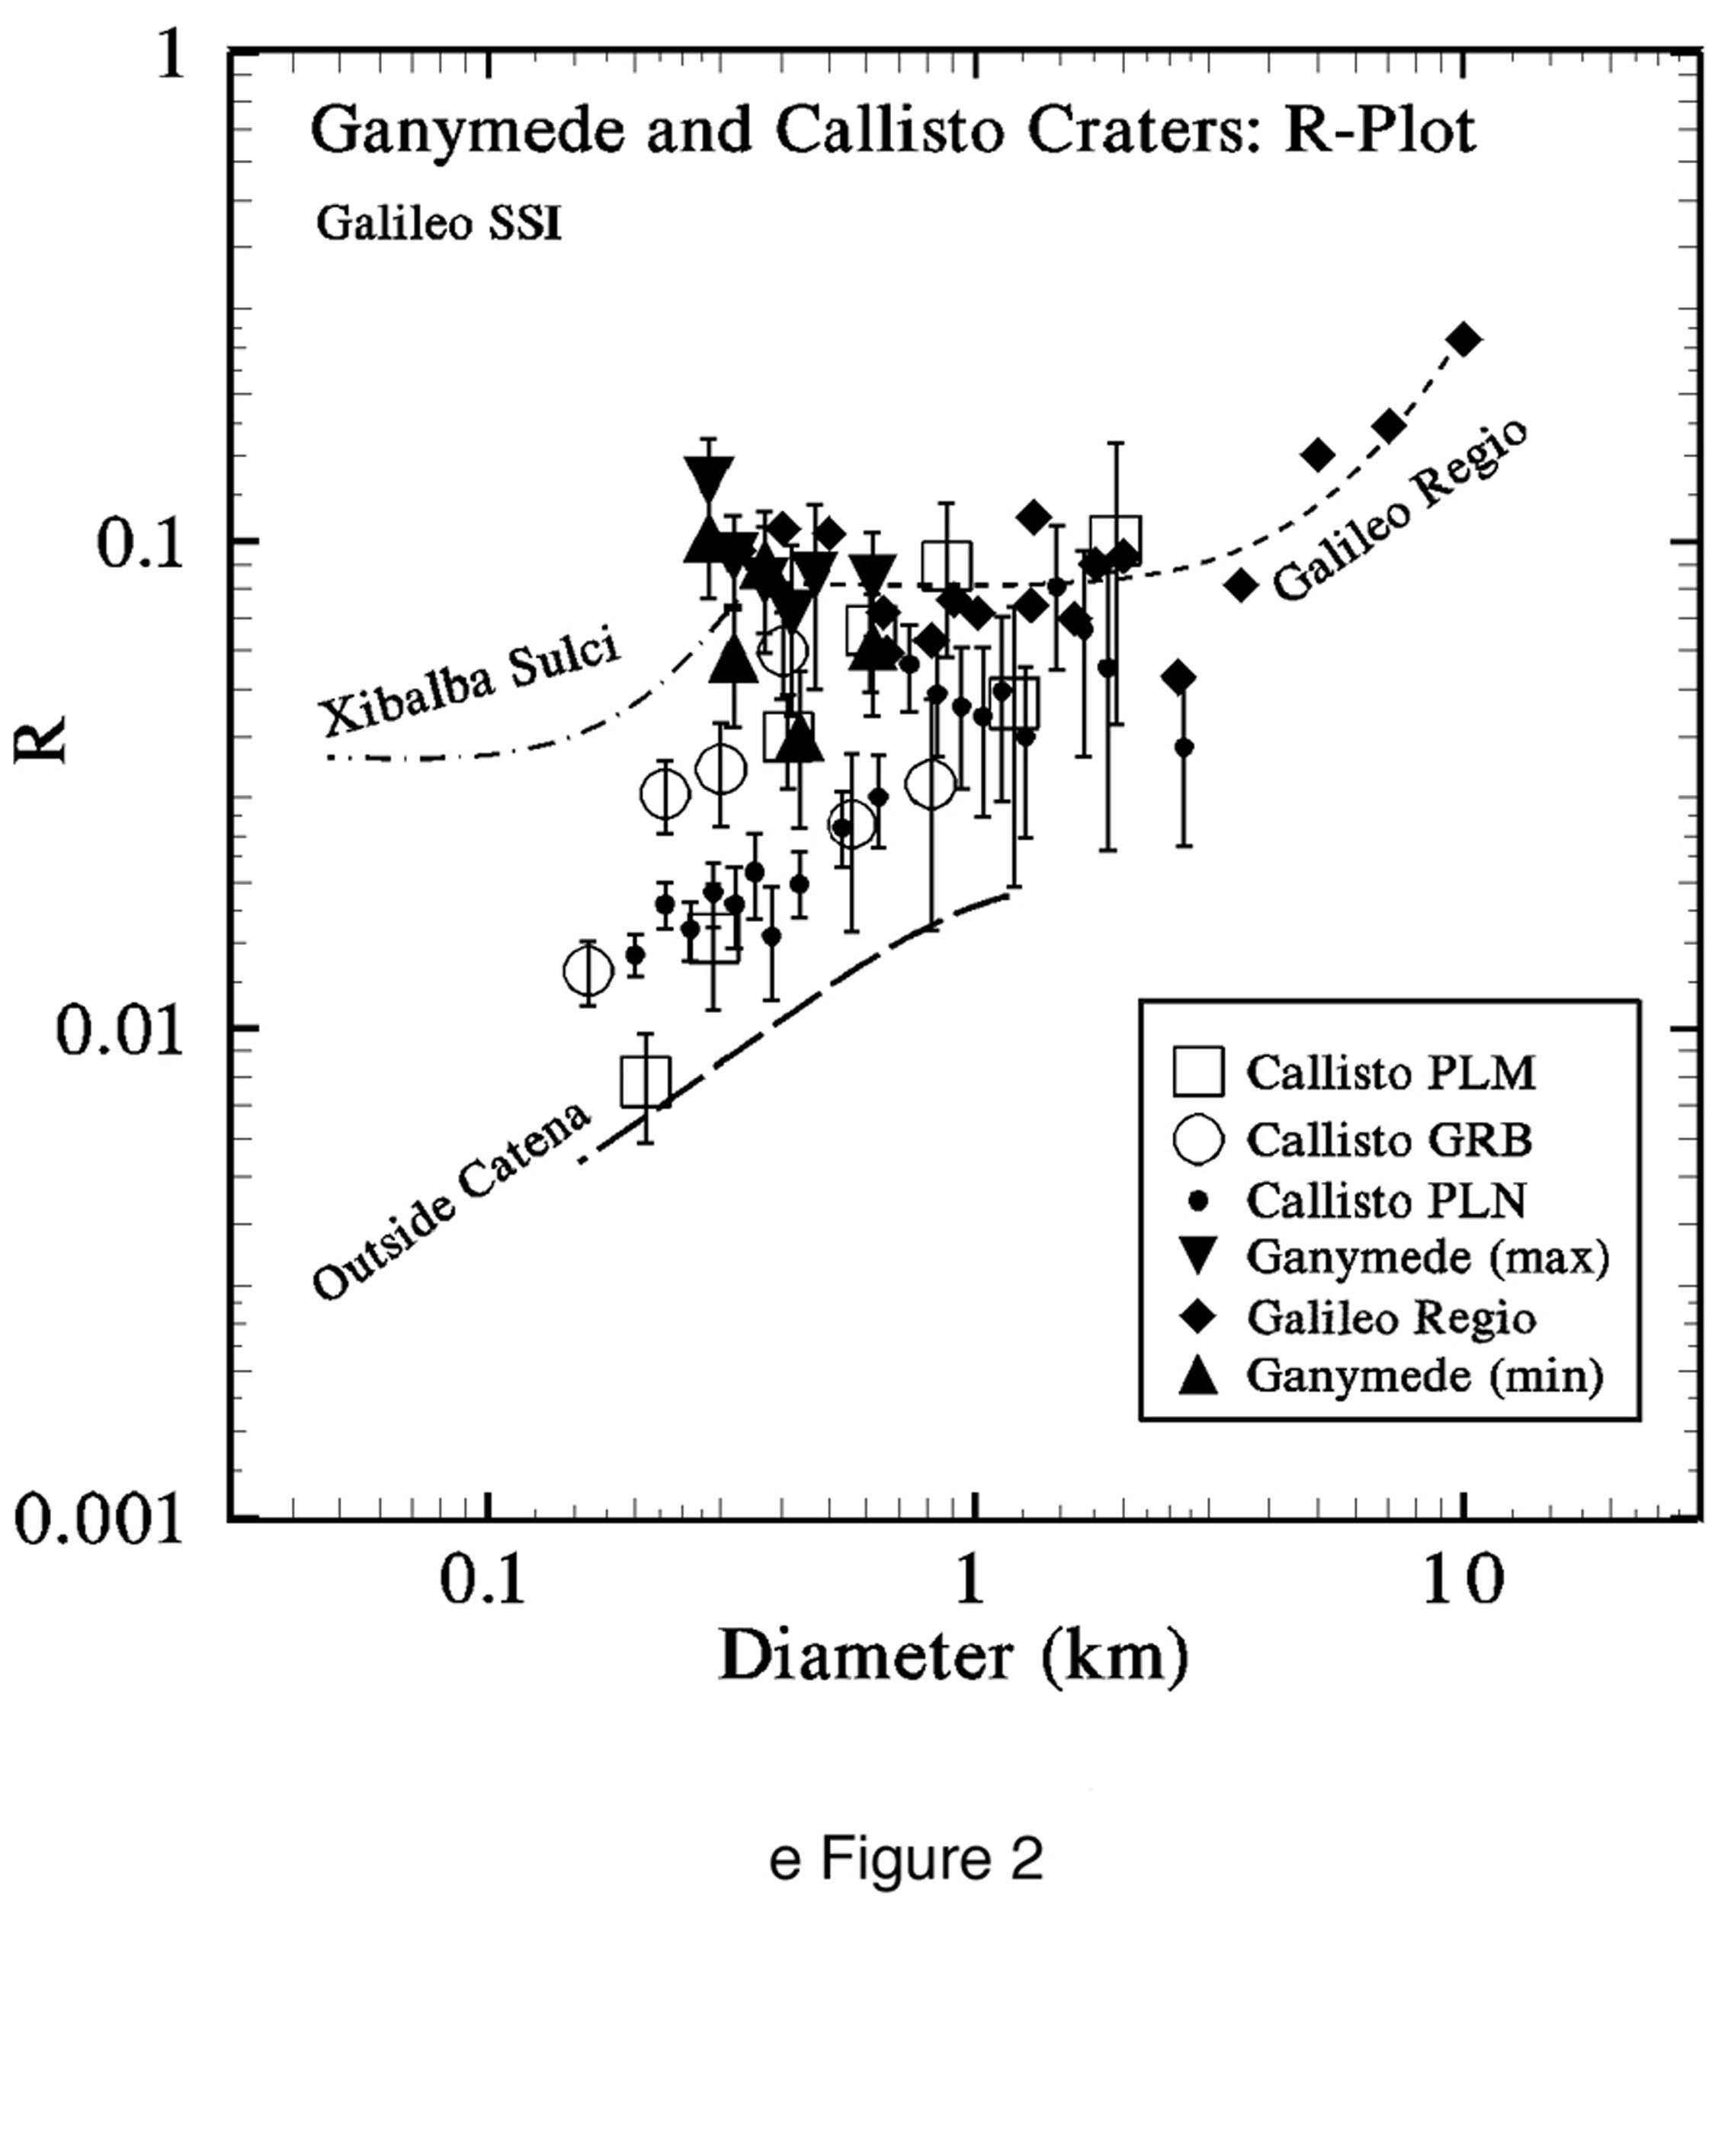
eFigure 2 Plot of relative crater densities on selected cratered terrains of Ganymede and Callisto illustrates different trends on the two satellites. The surfaces of Callisto and on Ganymede's dark terrain are thought to be ancient (~ 4 Gyr old), yet the paucity of 0.1-1 km-scale craters on Callisto relative to Ganymede is obvious. Crater counts for Callisto were taken from the low sun, 35-to-50 m/pixel “Palimpsest” (PLM), “Graben” (GRB), and “Plains” (PLN) image sequences acquired during the C3 orbit. Trends for small craters on Callisto (including the fit for counts [individual points not shown] for small craters outside of the large catena-craters in the Gipul catena sequence) trend upwards toward the right at a slope of 1/2 to 1, whereas counts for Ganymede are nearly horizontal, or sloping upwards only slightly. Diamonds without error bars and associated line-fit for Galileo Regio are shown, as well as a fit to counts of very small craters on Xibalba Sulci (observed at 11 m/pixel) which represent the minimum crater densities counted on Ganymede. "Max" and "min" indicate the range of best estimates of crater densities just outside of Memphis Facula, studied from the overlapping region of two moderately high-resolution frames. ("Min" indicates craters independently identified on both of the frames; "max" indicates craters identified on one or the other of the frames.) The nearly horizontal (differential power-law index = -3) slope for Ganymede at smaller diameters is shallower than the typical -4 to -4.5 slope for inner solar system crater curves at these sizes, suggesting a relative depletion of smaller impactors compared to the inner solar system. But the -2 to -2.5 slope for Callisto implies an additional factor, presumably related to the disaggregation and filling processes on the undulating smooth units on Callisto. (From Moore et al. 1999)
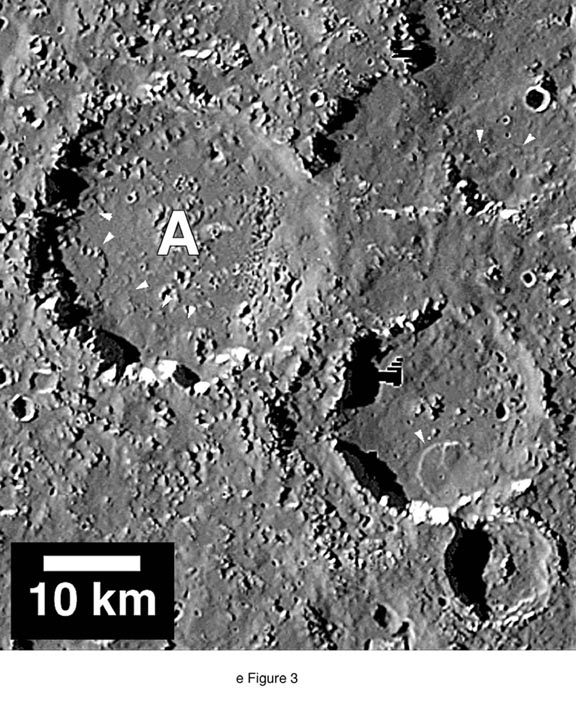
e Figure 3. Possible evidence of crater widening by
multiple debris avalanches on Callisto (see arrows within crater A). Image resolution
160 m/pixel, North is up and illumination is low and from the West. Scene center
coordinates are ~5°S, 7°W. (A mosaic of portions of Galileo images
PICNO C9C0005, 06, 07, 08) (From Moore et al. 1999)
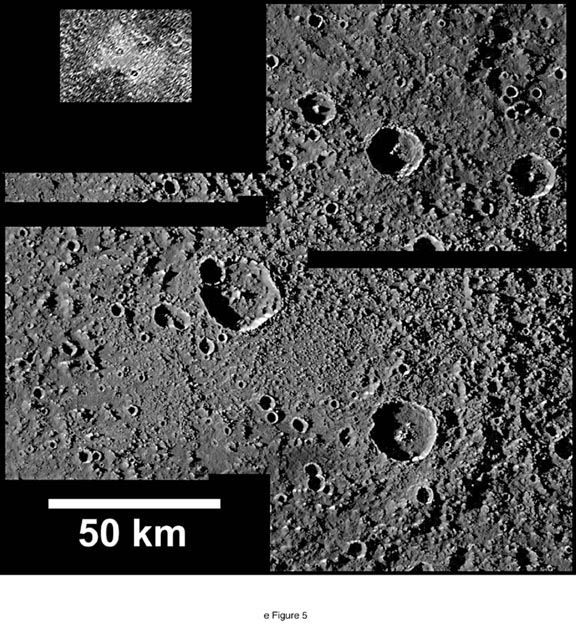
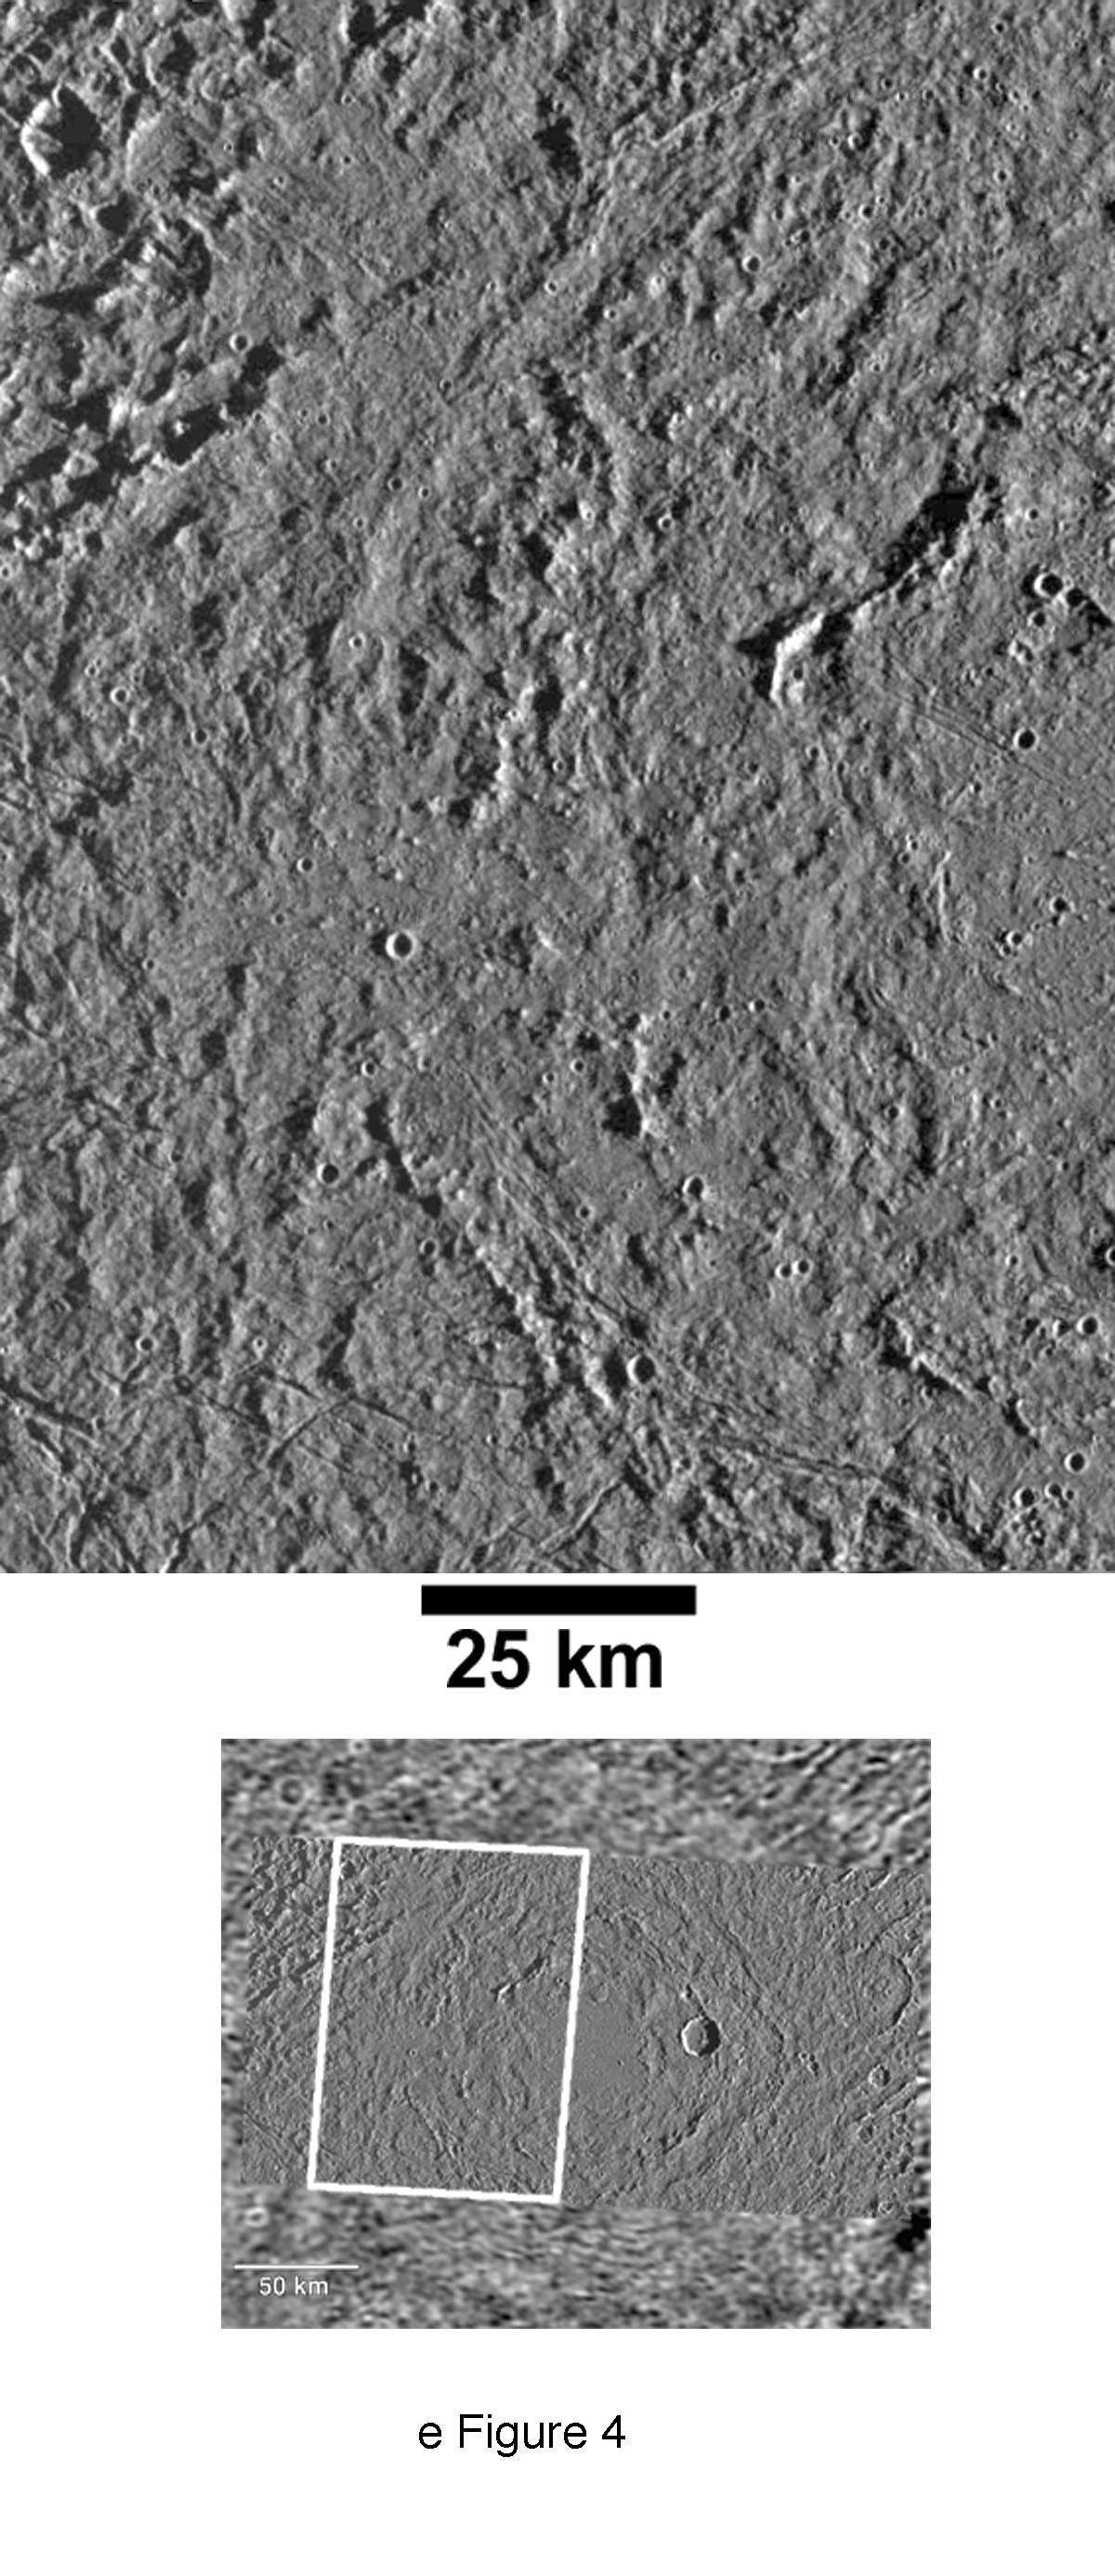
e Figure 4. Low lighting view of the eastern half of
Buto Facula on Ganymede, illustrating the appearance of an uneroded palimpsest.
(A portion of Galileo image PICNO G8G0007, centered ~14°N, 205°W,
North is up. Sun is low and from the right.)
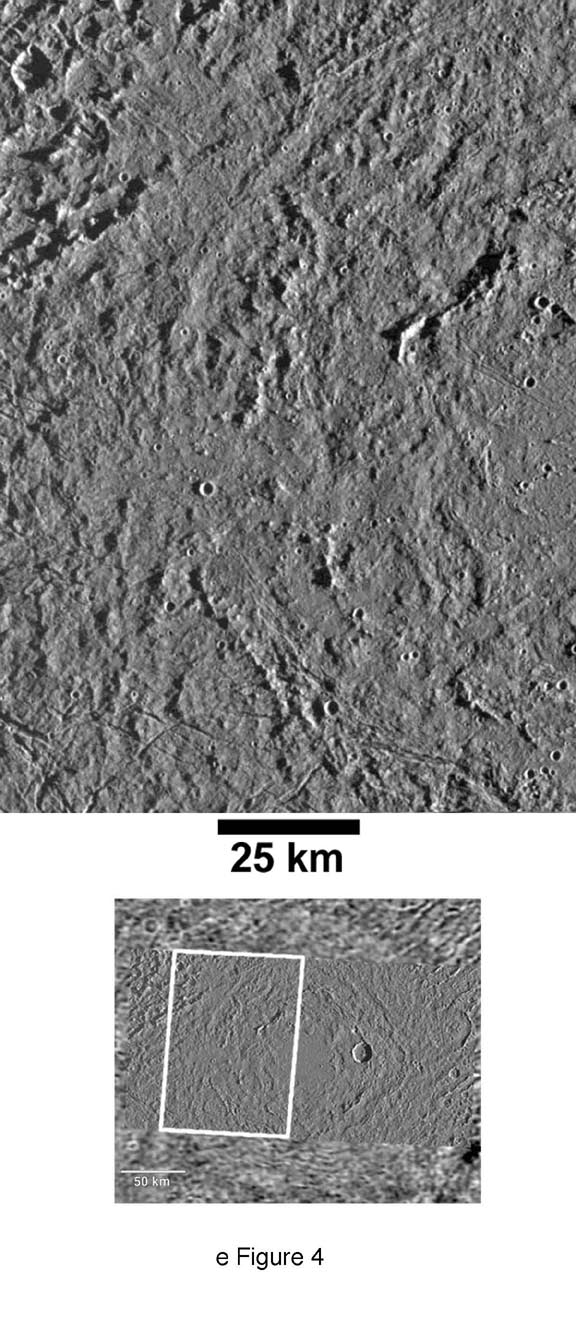
e Figure 5. Low lighting view of an eroded palimpsest
on Callisto shown at a resolution and illumination similar to that of Ganymede’s
Buto Facula in e Fig. 4. Inset shows a ~ 3 km/pixel view of the same palimpsest
acquired by Voyager. At this coarse (Voyager) resolution, this feature
appears smooth. (Mosaic of Galileo images PICNOs 10C0026, 27, and 28, centered
~14.4°N, 351.5°W, North is up. Sun is low and from the left.)
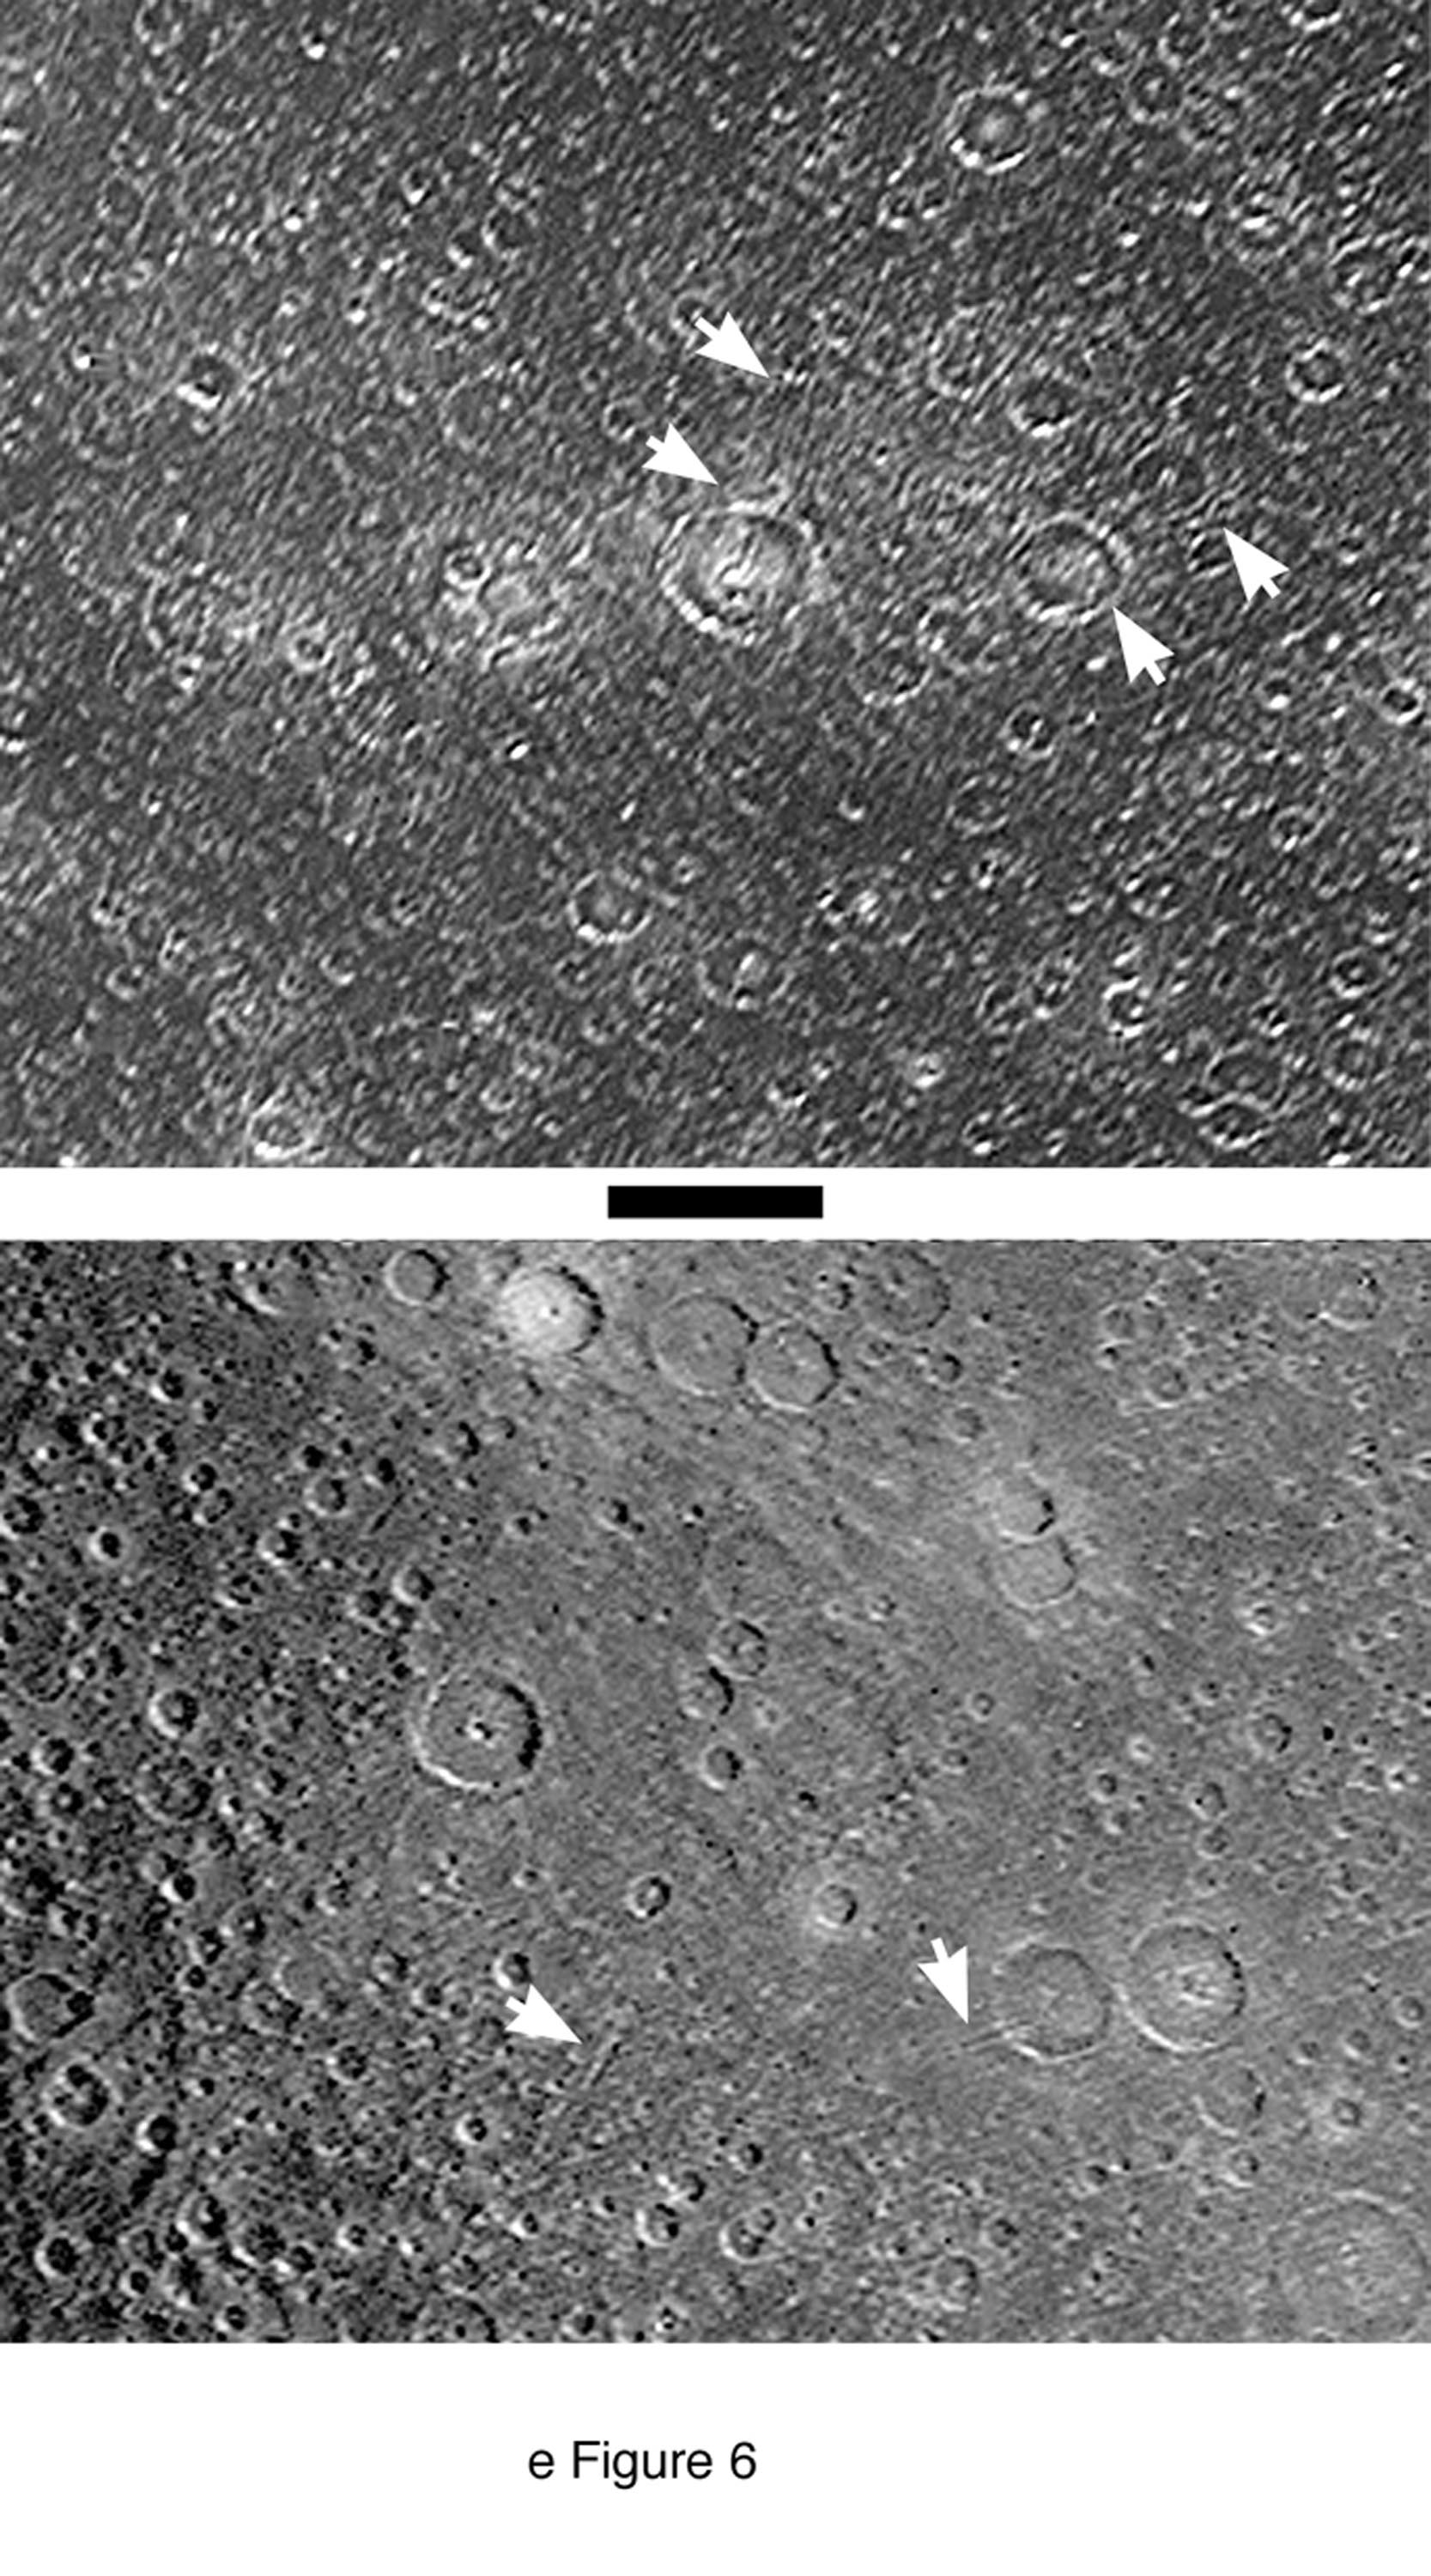
e Figure 6. Examples of possible non-impact-related
lineaments (large arrows) on Callisto. Top: The central dome crater Tir is located
in the center of the frame. The large-dome crater Har is just to the left of
Tir. (Portion of Voyager 1 image FDS 16421.30, centered ~4°S, 357°W,
illumination is very high sun) Bottom: Several sets of lineaments (arrows) distant
from those in the top image. (Portion of Voyager 2 image FDS 20616.57
centered ~33°N, 262°W, illumination is low and from the right) North
is up in both images. Common scale bar is 100 km.
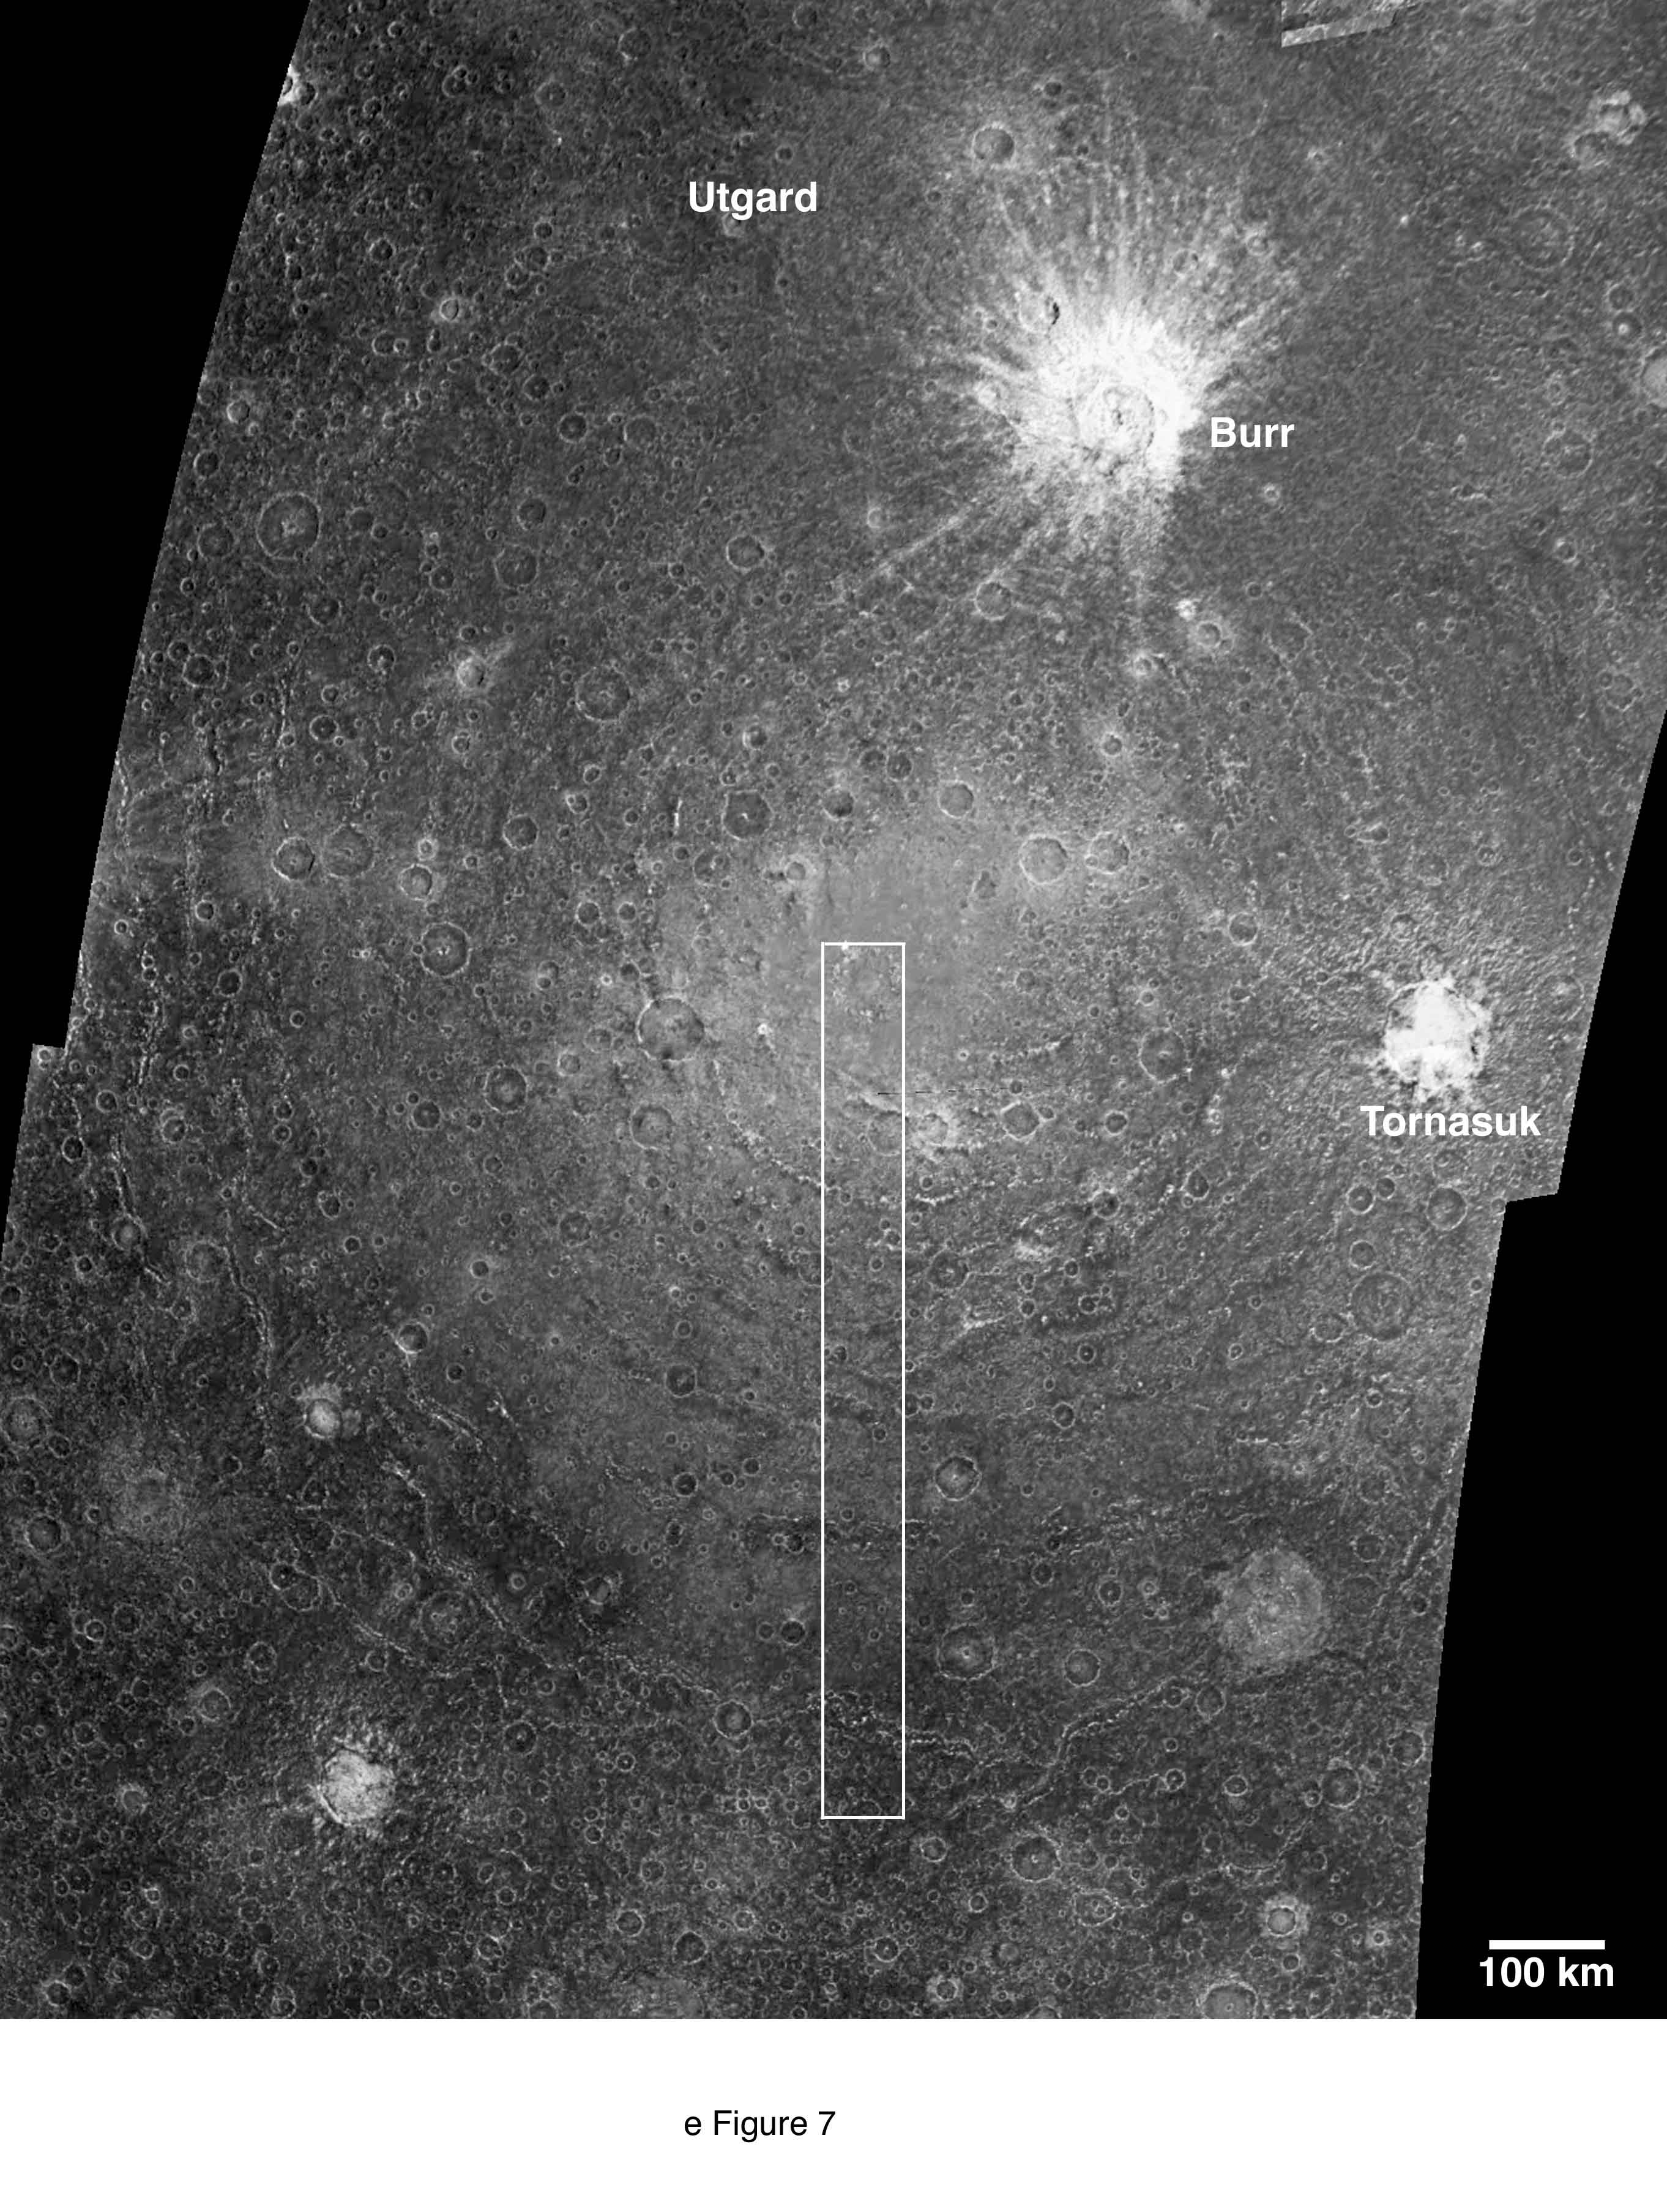
e Figure 7. Mosaic of Galileo images showing the Asgard
multiringed structure at 1.1 m/pixel. (Galileo images PICNOs C3C0020,21,22,
and 23, centered ~28°N, 145°W, North is up. Sun elevation is moderate
and from the right.) Utgard is a degraded multiring structure partly obscured
by the fresh, bright-rayed crater, Burr. Tornarsuk crater is east of the central
zone of Asgard. The white box outlines the moderate resolution "transect"
shown in the next figure (e Fig. 8). (From Greeley et al. 2000)
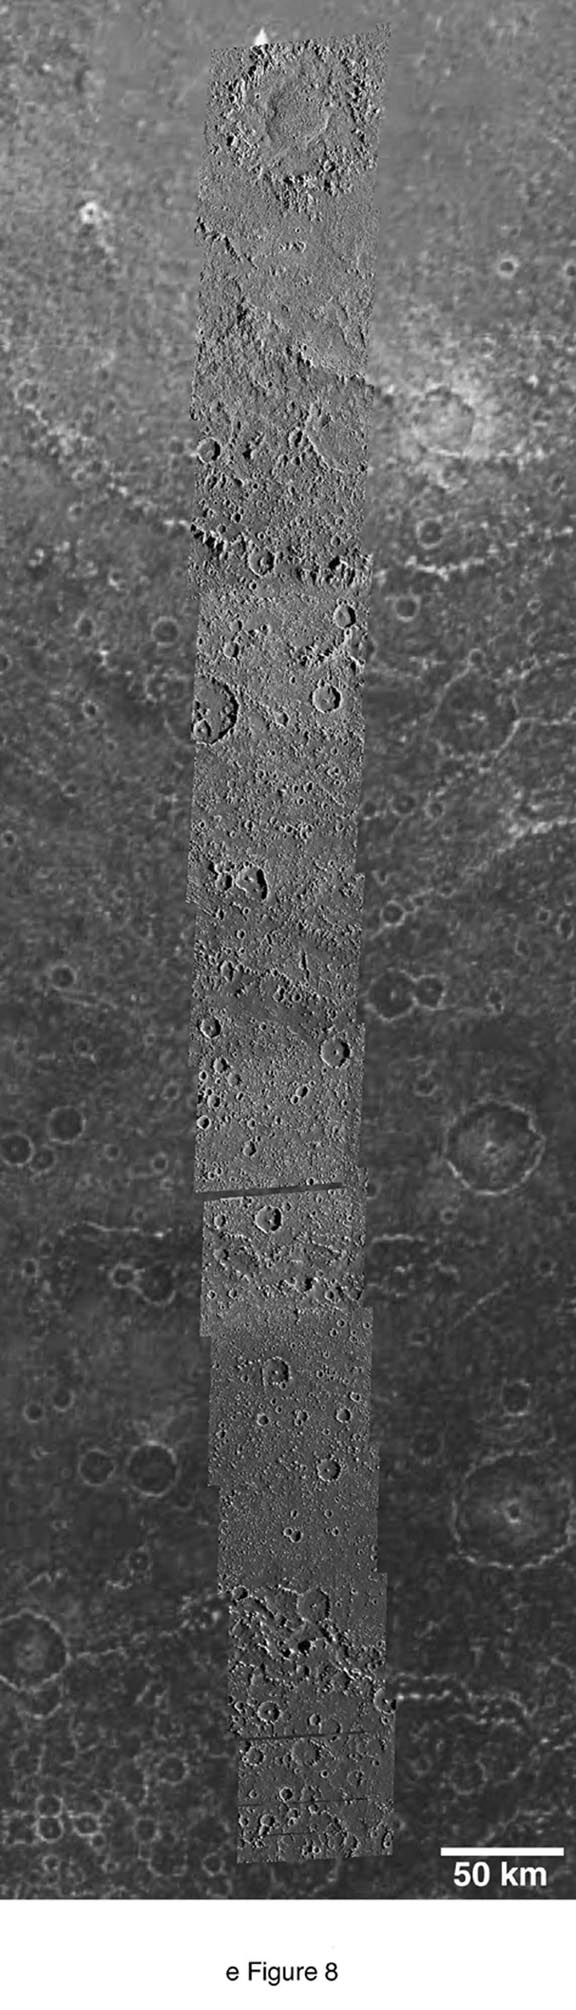
e Figure 8. A "transect" of moderate resolution
(90 m/pixel) Galileo images from near the center of the Asgard multiringed
structure (top) south to the outer trough zone. Doh crater is seen at the north
(top) end of the transect. These images are set in a base mosaic of lower resolution
Galileo images (e Fig. 7.) for context. (Mosaic of Galileo images
from observation 10CSASGARDL01 mapped to a mosaic-centered Lambertian equal-area
projection. North is up. Sun is low and from the right. (From Greeley et
al. 2000)
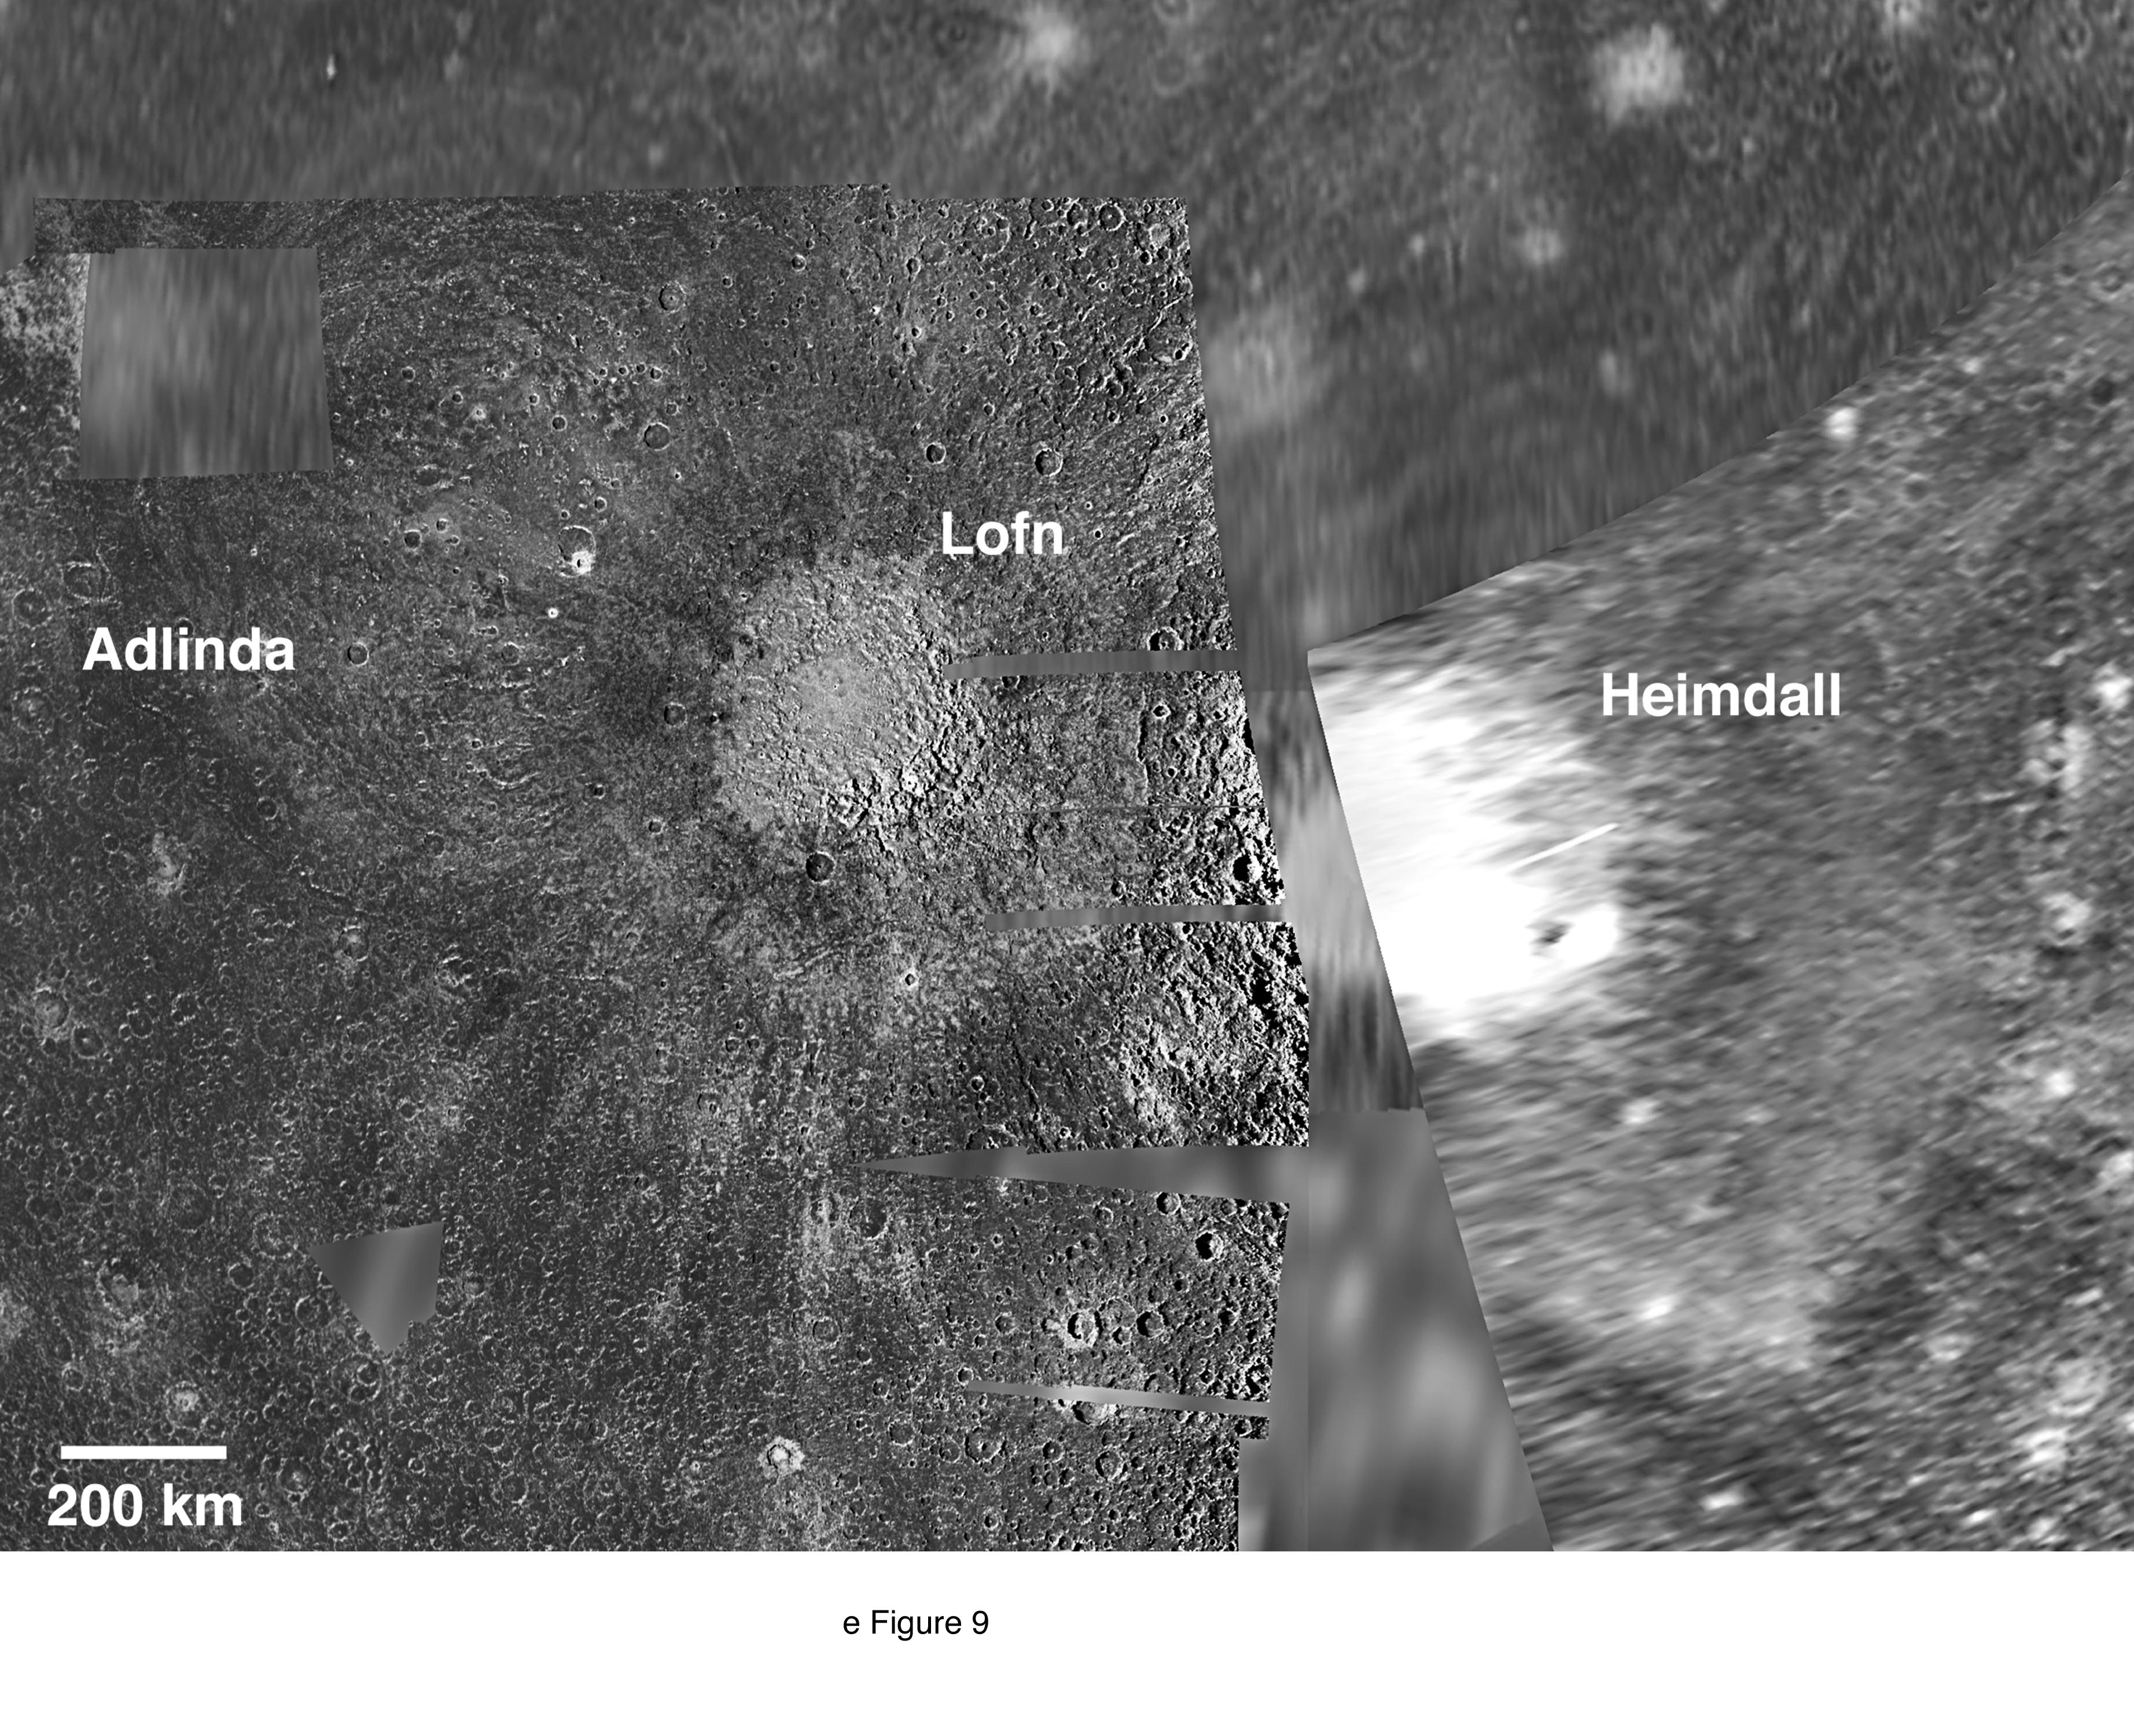
e Figure 9. Digital image map of moderate resolution
(left side; 876 m/pixel) and low resolution (right side; 4.3 km/pixel) Galileo
images combined with Voyager images (top, 2 km/pixel; central gore, 20
km/pixel), showing the Adlinda multiring structure and Lofn and Heimdall craters.
(Figure centered at ~60°S, 10°W. North is up.) (From Greeley et al.
2000)
e Figure 10. Energy flux diagram. We consider a vertical
icy scarp at midday, overlooking a horizontal plain covered in dark material,
and compare its energy balance with that of a hypothesized horizontal bright
icy surface at the top of the scarp. We assume unit emissivity for all surfaces,
Lambertian scattering of sunlight, isotropic emission of thermal radiation,
and negligible thermal inertia for the dark material. See text. (From Moore
et al. 1999)
High resolution versions of these figures (JPEGs)
eFigure 1
eFigure 2
eFigure 3
eFigure 4
eFigure 5
eFigure 6
eFigure 7
eFigure 8
eFigure 9
eFigure 10