Supplemental Material
 NaCloud.jpg
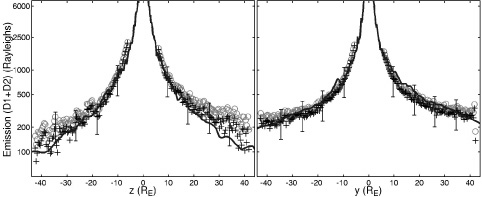
Europa sodium cloud and torus: density (Log 10 of Na/cm3) in Europa orbital plane seen from North pole with Europa at a phase angle of 90 degrees. Europa is placed at the center of the axis. Jupiter is represented by the circle on the axis x=0. The Earth and the Sun are in the +X direction. The dashed circle line represents the orbit of Europa around Jupiter. Distances along both axis are in Europa radii (RE). The 3 solid triangle lines represent the orientation of the set of observations done by M.E. Brown. These observations and the data used for this simulation are described in Leblanc et al. (2002). A comparison of calculated and line of sight column density is given in Figure 19.11.