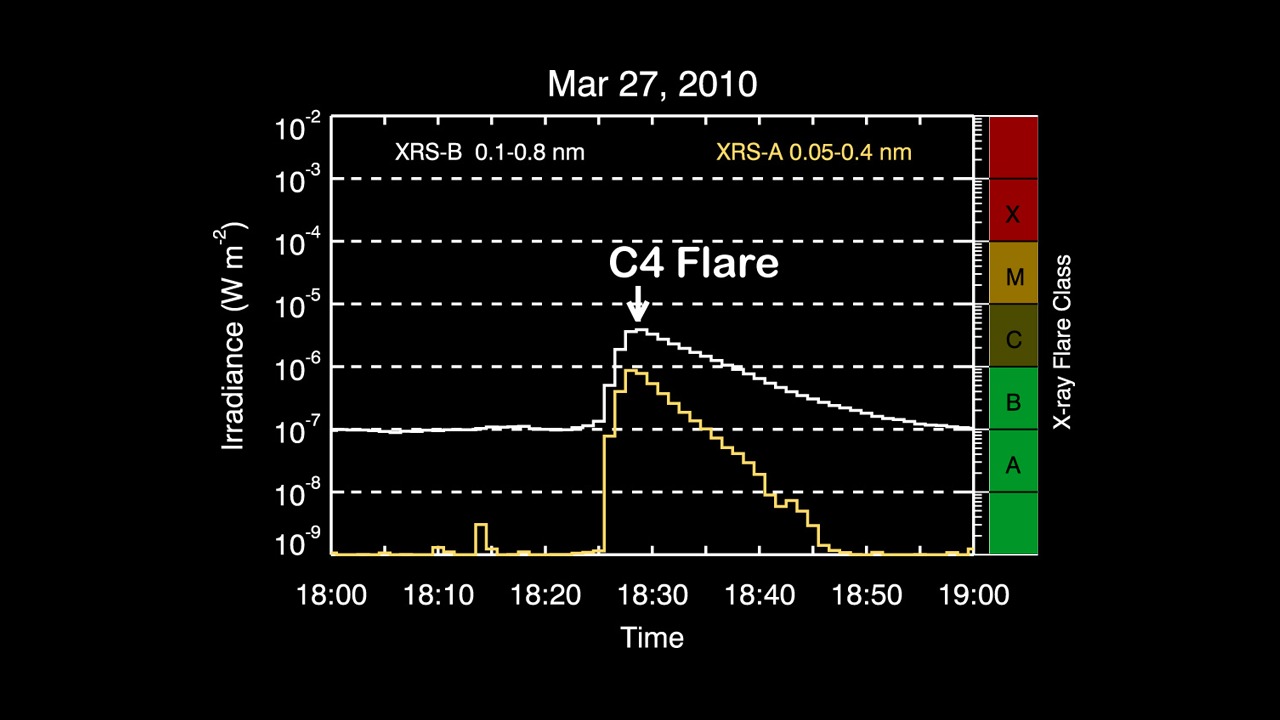
Caption: This slide shows the solar X-ray monitor from the NOAA GOES satellite. These X-ray measurements are used to provide flare warnings and to classify how bright each flare is. This slide indicates that there was a C4 type flare at about 18:30 on March 27, 2010 - just hours after the EVE instrument opened its doors and started to make solar observations.
Credit: Laboratory for Atmospheric and Space Physics / University of Colorado in Boulder, LASP/CU
Caption: This movie illustrates how the solar EUV irradiance, as measured by SDO EVE, varied during the C4 flare on March 27, 2010. The solar X-ray image from EVE is shown in the left panel. An X-ray image only shows the active regions on the sun, so it is somewhat difficult to visualize the solar disk. But it is very easy to tell when a flare goes off as one of the dim active regions will suddenly get brighter, that is flare up. The top right panel shows a small part of the solar EUV spectrum. As you watch the movie, you will notice that the many hot iron emission lines in the solar corona will suddenly go up and then decay down more slowly. The bottom right panel shows the time series of just three emissions. An interesting aspect of watching the time series is that each emission has its own story to tell about the flare event. Some wavelengths rise faster than others. They peak at different times. And they decay back down at different rates. This movie only highlights three emisisons in the time series plot, but EVE measures the full EUV spectrum, more than a hundred different emissions.
Last modified: Wed Apr 21 11:13:39 MDT 2010