
Archive of Earlier Observations
Cassini ‘tastes’ organic brew at Saturn’s geyser moon

March 26, 2008. Streams of high-density gas detected by Cassini’s Ultraviolet Imaging Spectromer (UVIS) on Saturn’s moon Enceladus match the locations of dust jets determined from Cassini images, labeled here with Roman numerals. The spectrograph pinpointed the locations of individual gas streams in the plume in a ‘stellar occultation’ which involves measuring the light of a star, (in this case, zeta Orionis), as it passed behind the plume from Cassini’s viewpoint.
The blue line in this projection shows the path of the starlight through the plume,over the south polar region of Enceladus. The instrument looked at the star across this path in the direction indicated by the short blue lines.
Some of the dust jets appear to merge together in UVIS stellar occultation data. The dimming of starlight labeled “a” was caused by dust jets V and VII. The dimming of starlight marked as feature “b” is probably off-set too far to be associated with dust jet I, because the jet is not perfectly vertical. Dimming of starlight labeled “c” corresponds to dust jet VI, and “d” is dust jet III, with dust jet II in between. The individual jets come from sources with an area of less than 300 by 300 meters (1,000 feet square) – about the size of half a tennis court — probably stretched out rectangularly along the tiger stripes. The new UVIS data indicate that the water molecules are blasting off from Enceladus at faster than 600 meters per second (about 1,300 miles per hour.
Credit: NASA/JPL/University of Colorado/
Two views of Iapetus
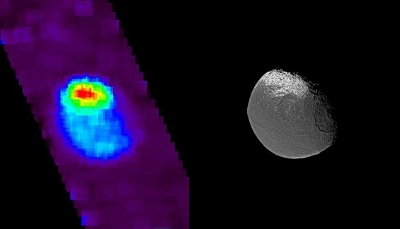
Saturn’s odd, two-toned, walnut-shaped moon, Iapetus, has a ridge of surprisingly large mountains — the so-called “belly-band” — that lies directly on top of the equator. The moon also has a distinct difference in the brightness of its leading and trailing hemispheres, one as bright as snow and the other dark as tar. The ultraviolet-light image taken with UVIS (left) was taken during a flyby in December 2004. A visible light image taken on the same date is shown on the right for reference. The ultraviolet image indicates water ice abundance across the surface: the bright north polar terrain (shown in red) is the iciest region in this view. Away from the pole, as the color shifts to blue, less water ice is present in the surface. The darkest terrain, which includes very little water ice, is shown in light blue. The dark sky background viewed during the observation is shown as purple in this color scheme.
Cassini will make its only close flyby of Iapetus on Sept. 10, 2007, at about 1,640 kilometers (1,000 miles) from the surface which will be 100 times closer than Cassini’s 2004 encounter, and will be the last time the spacecraft will aim its instruments at this moon. The irregular shape, the mountain ridge and Iapetus’ brightness contrast are among the key mysteries scientists are trying to solve.
Credit: NASA/JPL/University of Colorado/Space Science Institute (PIA09970)
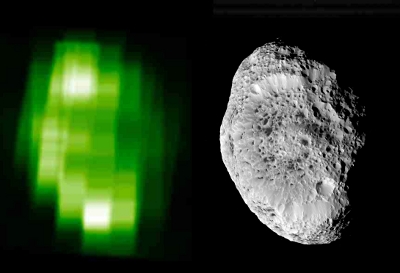
Hyperion’s Icy Surface – July 4, 2007
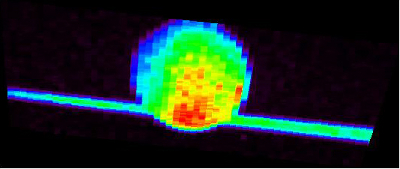
In this ultraviolet image of Hyperion, produced using data taken with UVIS during the September 2005 close flyby, brightness contrasts are due to both topographic and compositional variations across the surface. The brightest regions are exposed water ice in the rim of the crater that dominates the hemisphere in view.
This new ultraviolet map (left) is shown next to a previously released image (right) taken by the Imaging Science Subsystem.
Credit: NASA/JPL/University of Colorado/Space Science Institute
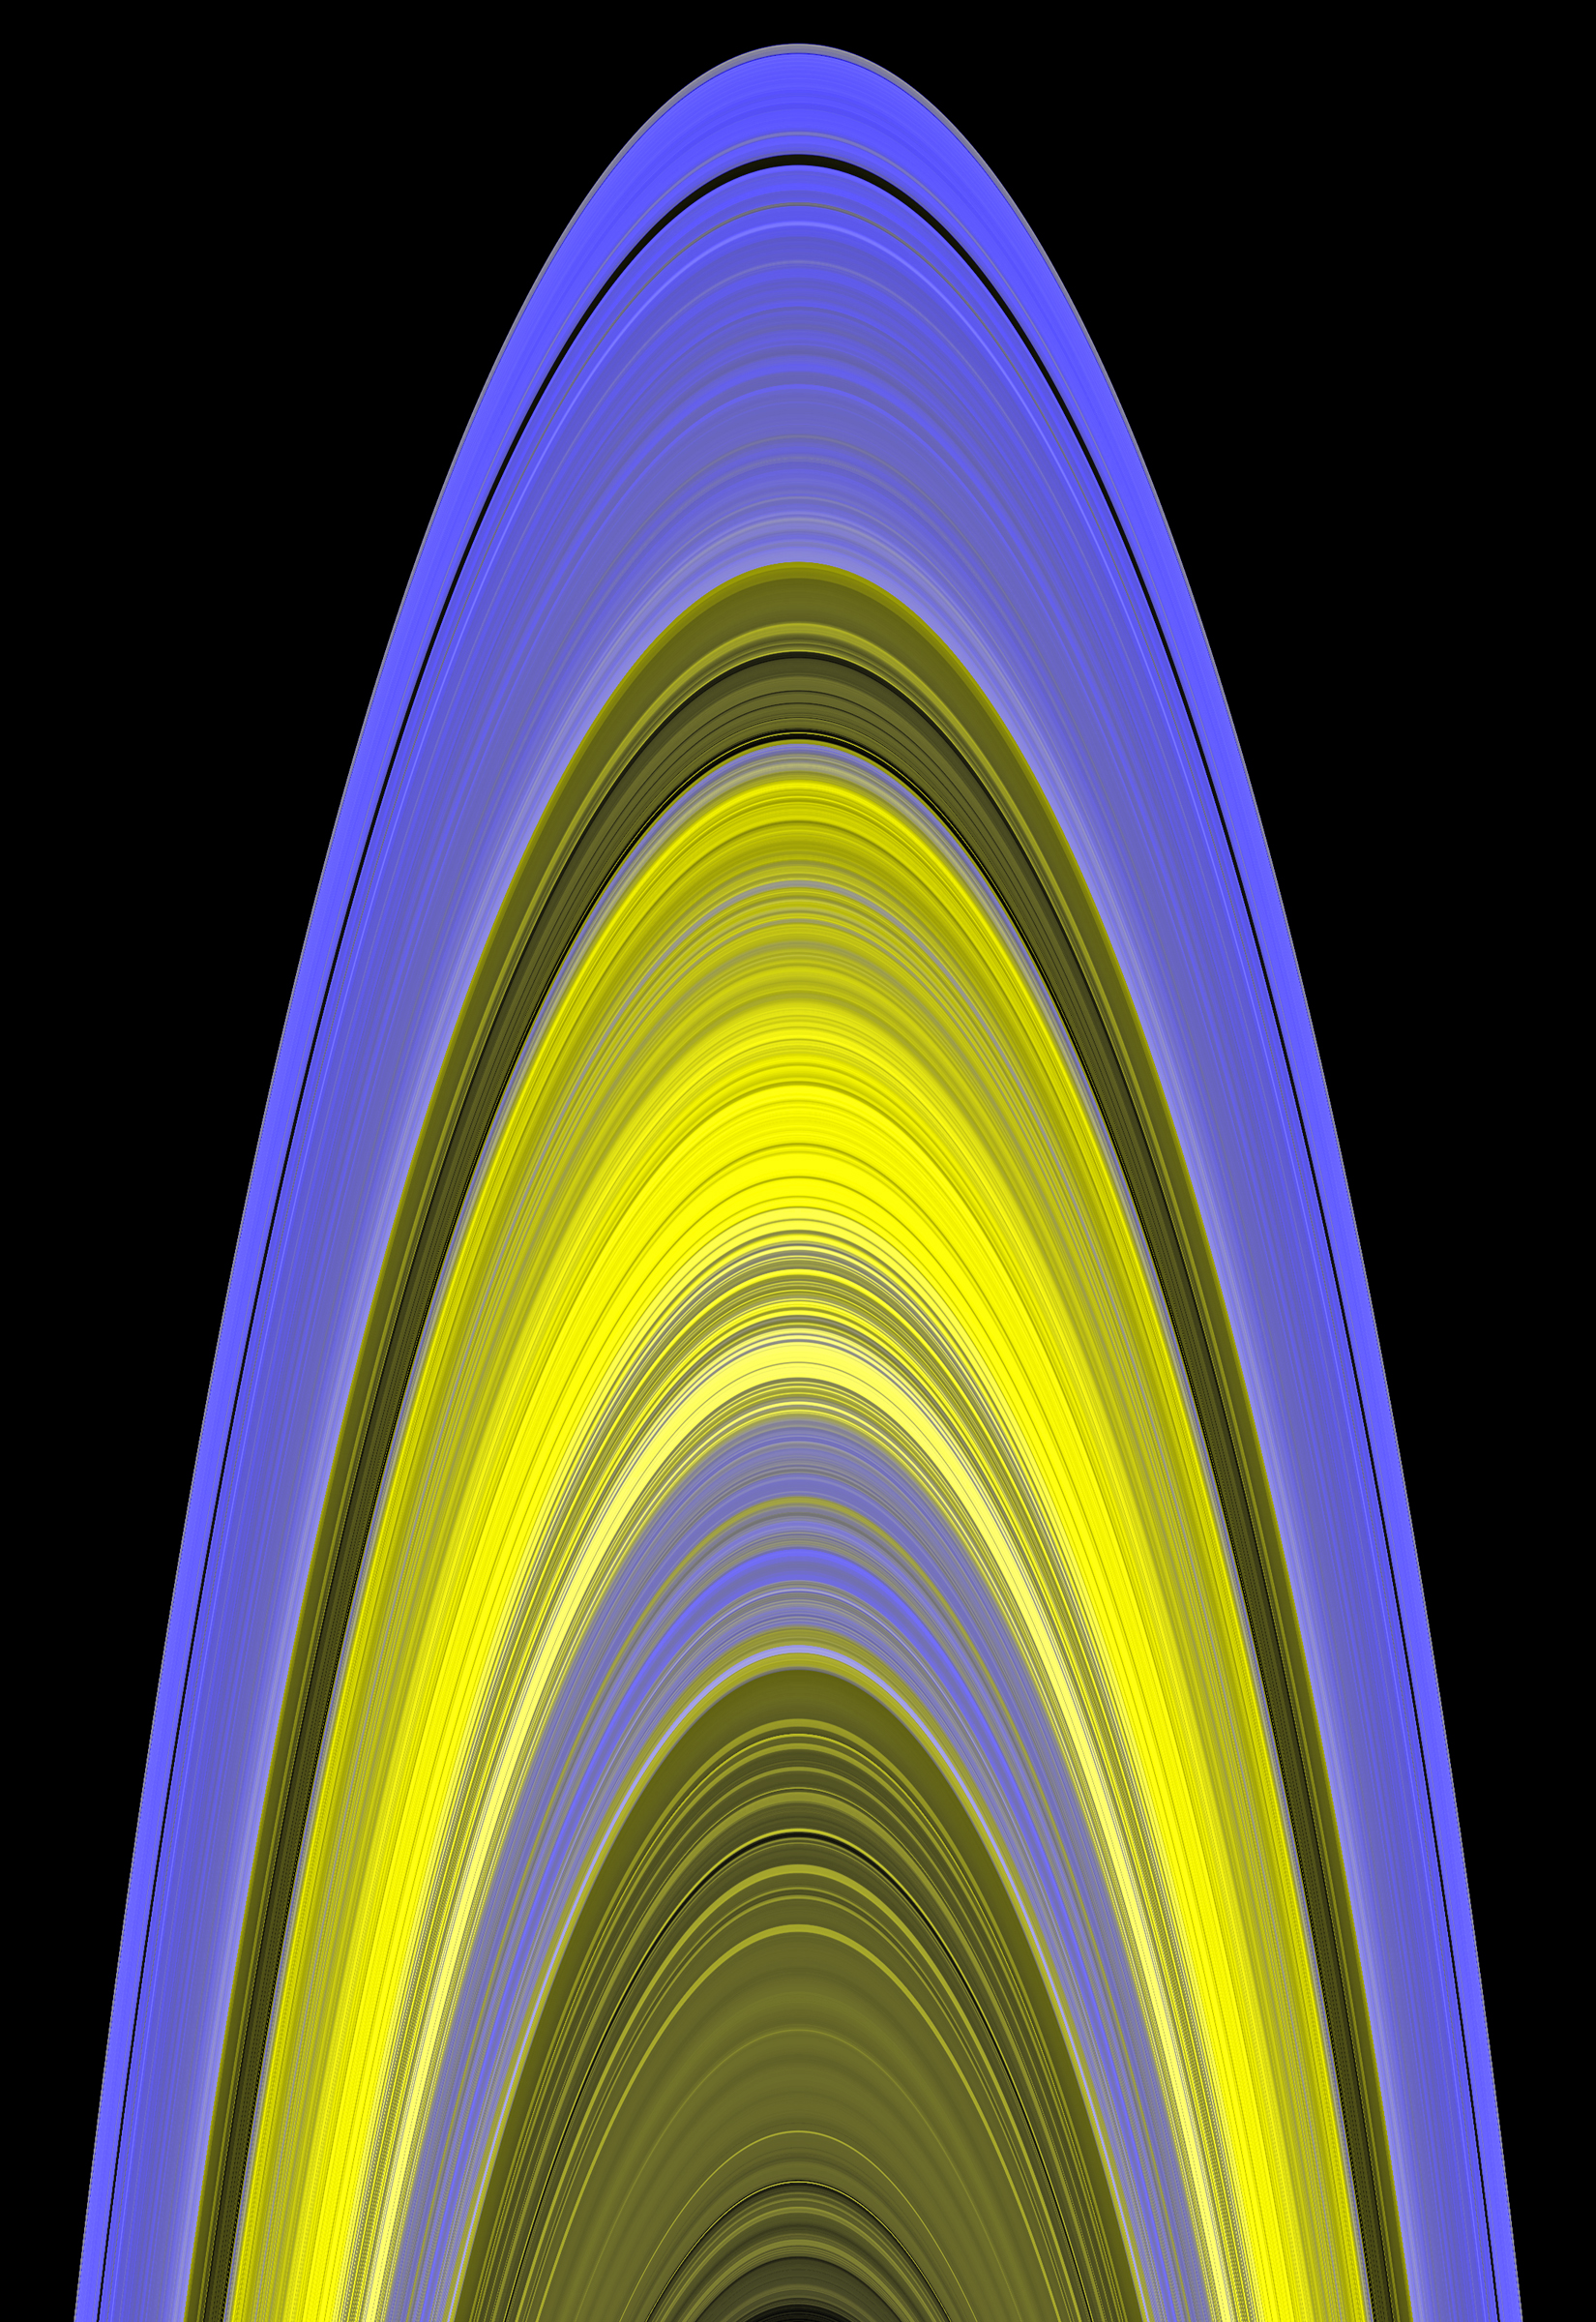
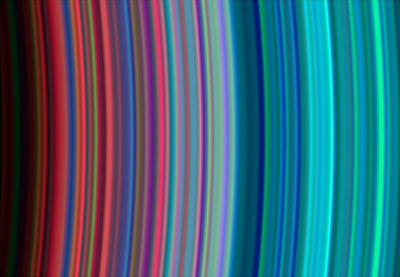
Mapping Clumps in Saturn’s Rings – May 22, 2007
This false-color image of Saturn’s main rings was made by combining data from multiple star occultations using the Cassini ultraviolet imaging spectrograph (UVIS).
During occultations, scientists observe the brightness of a star as the rings pass in front of the star. This provides a measurement of the amount of ring material between the spacecraft and the star.
Cassini has given scientists the most detailed view yet of Saturn’s densely packed B ring. Cassini found that this part of the rings is densely packed with clumps, called self-gravity wakes, separated by nearly empty gaps. These clumps in Saturn’s B ring are neatly organized and constantly colliding, which surprised scientists.
The clumps in Saturn’s B ring, 30 to 50 meters (100 to 160 feet) across, are too small to be seen directly. However, scientists can map the distribution, shape and orientation of the clumps. Colors in this image indicate the orientation of clumps, and brightness indicates the density of ring particles. The formation of wakes is strongest in the bluer regions, where ring particles clump together in tilted wakes. Particles in the central yellow regions are too densely packed for any starlight to pass through.
Credit: NASA/JPL/ University of Colorado (PIA09210)
The Cassini-Huygens mission is a cooperative project of NASA, the European Space Agency and the Italian Space Agency. The Jet Propulsion Laboratory, a division of the California Institute of Technology in Pasadena, manages the mission for NASA’s Science Mission Directorate, Washington, D.C. The Cassini orbiter was designed, developed and assembled at JPL. The ultraviolet imaging spectrograph was designed and built at, and the team is based at the University of Colorado, Boulder.
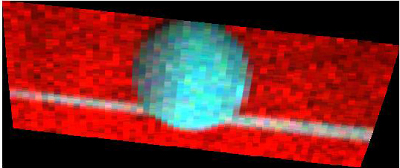
Amanda Hendrix: Rhea imaged in front of the rings of Saturn
Rhea is imaged at UV wavelengths, with Saturn’s rings in the background, in these images from November 18, 2005. The two images show the same geometry but use varying color schemes to accentuate different wavelengths. The top image is a 3-color UV image, where red represents Lyman-alpha (1216 Angstroms), characterizing the background hydrogen. Blue and green represent longer-wavelength FUV light, displaying reflected solar light from the water-ice-rich surface. The lower (rainbow) image highlights the reflected solar component, with increased brightness near the sub-solar region in the south. A bright, fresh crater on the right limb also is relatively reflective.
NEW CASSINI IMAGES SHOW “NORTHERN LIGHTS” OF SATURN
New images of Saturn obtained by UVIS on June 21, 2005 show auroral emissions at its poles similar to Earth’s Northern Lights.
The two UV images, invisible to the human eye, are the first from the Cassini-Huygens mission to capture the entire “oval” of the auroral emissions at Saturn’s south pole. They also show similar emissions at Saturn’s north pole, according to Larry Esposito, principal investigator and Wayne Pryor.
In the false-color images, blue represents aurora emissions from hydrogen gas excited by electron bombardment, while red-orange represents reflected sunlight. The images show that the aurora lights at the polar regions respond rapidly to changes in the solar wind, said the researchers. Previous images have been taken closer to the equator, making it difficult to see the polar regions.
Major changes in the emissions inside the Saturn south-pole aurora are evident by comparing the two images, which were taken about one hour apart, they said. The brightest spot in the left aurora fades, and a bright spot appears in the middle of the aurora in the second image.
Made by slowly scanning the UVIS instrument across the planet, the images also contain more than 2,000 wavelengths of spectral information within each picture element. We will use the wavelength information to study Saturn’s auroras, gases, and hazes and their changing distributions.
See full Press Release on the JPL site
See story on Planetary Society Site
UVIS Detects and atmosphere around Enceladus
Uploaded August 3, 2005
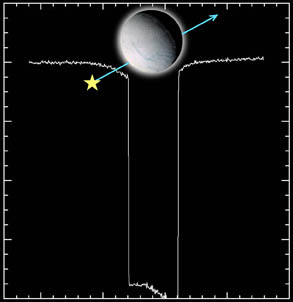
The Cassini Ultraviolet Imaging Spectrograph (UVIS) has made the first direct detection of an atmosphere around Saturn’s moon Enceladus, first suggested by Cassini magnetometer measurements. The UVIS observed the star Gamma Orionis as Enceladus crossed in front of the star. The light of the star dimmed as it was obscured by the atmosphere before being blocked entirely by Enceladus. The spectrum of the starlight changed as it passed through the atmosphere and indicates the presence of water vapor in the atmosphere. UVIS results suggest that the density of Enceladus’s atmosphere is not globally uniform and may be consistent with a greater amount of atmospheric gas near the south polar region. The presence of water vapor is more consistent with warm water ice than with sputtering or photodesorption.
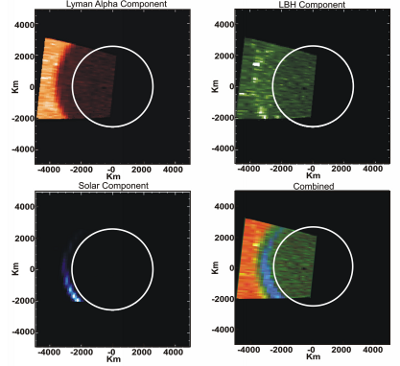
Two Images of Saturn’s 1) Non-organized Aurora; 2) Lyman-Alpha Absorption; and 3) Haze Layer
Released March 10, 2005
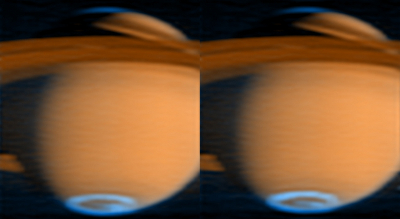
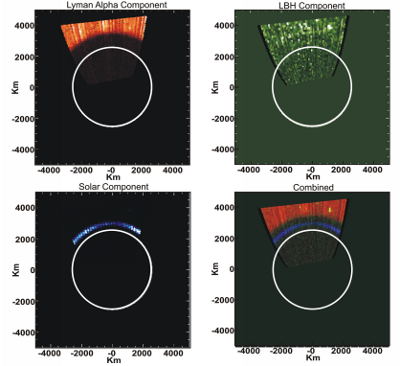
Images from two Titan fly-bys are presented, T-B (December 13, 2004) and T-3 (February 15, 2005). Both images are of Titan.s atmosphere and show similar features, but with minor differences. The four panels show Titan in different ultraviolet wavelengths. The first panel, in the upper left, is Titan in the Lyman-alpha (121.6 nanometers). The solid surface of Titan is indicated by the white line. Lyman-alpha radiation, from interstellar and solar hydrogen, is absorbed by the methane in Titans atmosphere, as indicated by the dark region extending from Titan’s surface. The second frame, in the upper right, is formed from the wavelength range that includes the Lyman-Birge-Hopfield (LBH) band system of molecular Nitrogen. These emissions are similar to Earth’s aurora, but since Titan has no intrinsic magnetic field to focus the precipitating electrons at the poles, the ‘non-organized aurora’ extends over the entire moon. The frame in the lower left is composed of incoming solar radiation that is scattered by the haze in Titan’s atmosphere. It appears as a thin band as there is insufficient haze higher in the atmosphere to scatter the light, and too much lower where it absorbs all the light. The height of these haze layers agrees with measurements made by UVIS during stellar occultations in December and observations by the ISS. The final frame, in the lower right, is a combination of the other three frames, showing the spatial relation between the upper levels of Titan’s haze (blue), the extent of the thick methane atmosphere (red), and the extent of the ‘non-organized aurora’ (green).
 T-B (December 13, 2004) |
 T-3 (February 15, 2005) |
Movie: Changes in the Saturn Magneosphere’s atomic oxygen emission during Saturn approach, December 2003 – June 2004.
Cassini UVIS Images of neutral oxygen near Saturn – Taken on Saturn approach, December 2003 – June 2004. Note: A series of four images will loop three times.
Density Waves in Saturn’s A Ring
Released November 9, 2004 – This false color image of two density waves in Saturn’s A ring was made from the stellar occultation observed by Cassini’s ultraviolet imaging spectrograph when the spacecraft was 6.8 million kilometers (4.2 million miles) from Saturn.
Bright areas indicate the denser regions of the rings. The bright bands in the left part of the image are the “peaks” of a density wave caused by gravitational stirring of the rings by Saturn’s moon, Janus. A smaller density wave in the right half of the image is produced by the moon Pandora. The ultraviolet imaging spectrograph observed the brightness of the star Xi Ceti as the rings passed in front of it, and the flickering of the starlight was converted into the ring density depicted by the image. The image represents a distance of about 724 kilometers (450 miles), and the smallest features are about one-half mile across.
Water Ice in the Rings:
The UV spectrum allows us to measure the composition of the rings. These are color-enhanced images of the rings from the UVIS observations during the Saturn orbit insertion event—when Cassini entered Saturn’s orbit after a nearly seven year journey—on June 30th, 2004 (MST). The turquoise represents more water ice in the rings. The red represents the most transparent (optically thinnest) area in the rings.
This image shows the outer C and inner B rings respectively from left to right, with the inner B ring beginning a little more than halfway across the image. The general pattern is from “dirty” red particles to the denser ice shown in turquoise as the ringlets spread outward.
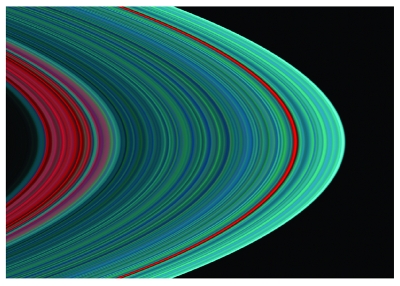
From the inside out, the “Cassini division” in faint red at left is followed by the A ring in its entirety. The A ring begins with a “dirty” interior of red followed by a general pattern of more turquoise further away from the planet, which indicates material made with more ice. The red band roughly three-fourths of the way outward in the A ring is known as the Encke gap.
Water Frost on Phoebe
Posted June 23, 2004
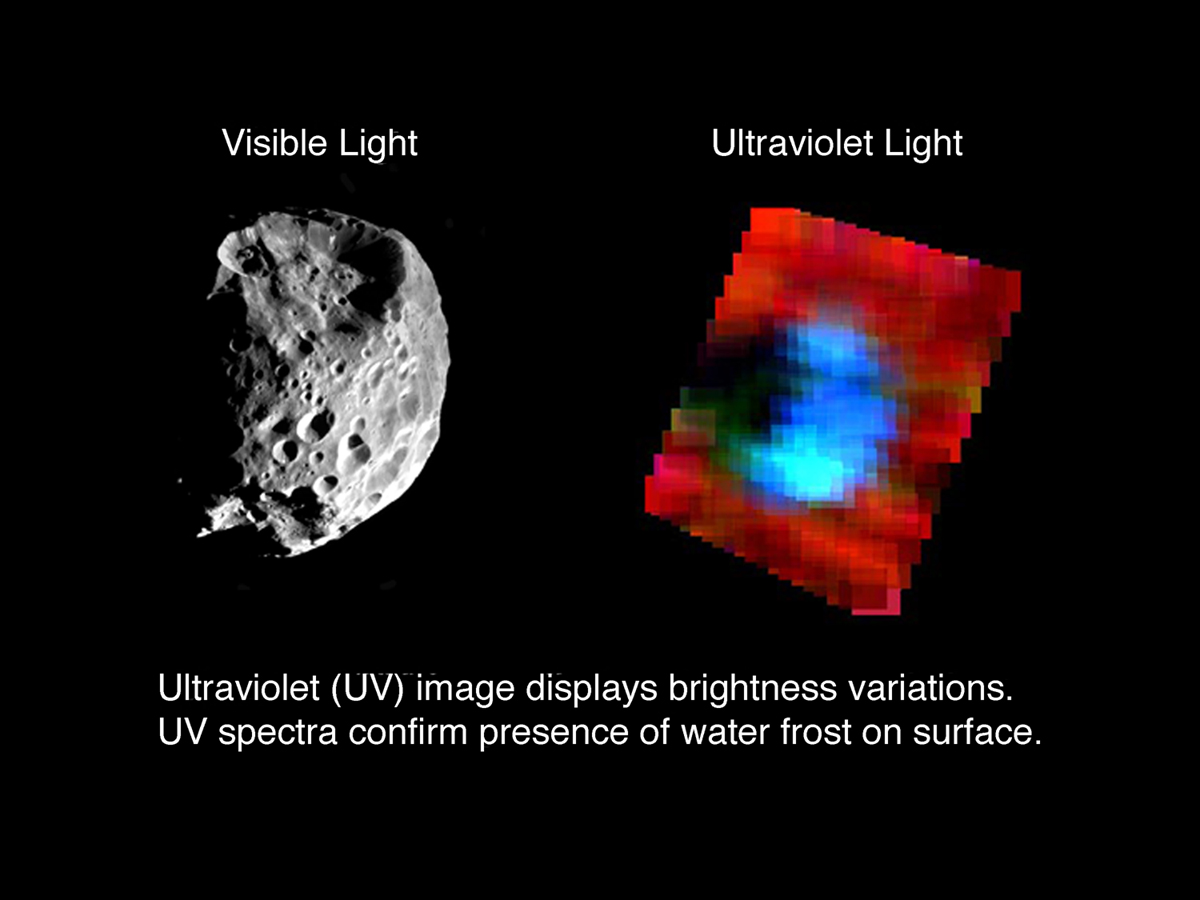
On the right side of the graphic, an ultraviolet image of Saturn’s moon Phoebe, taken at a distance of 31,000 km, shows an irregular surface and bright crater region (white area). The ultraviolet spectra confirm water frost on Phoebe’s surface. The image was taken by Cassini’s ultraviolet imaging spectrograph during the spacecraft’s closest approach to Phoebe, on June 11, 2004. The large crater shows clearly in the image on the left.
Saturn Approach
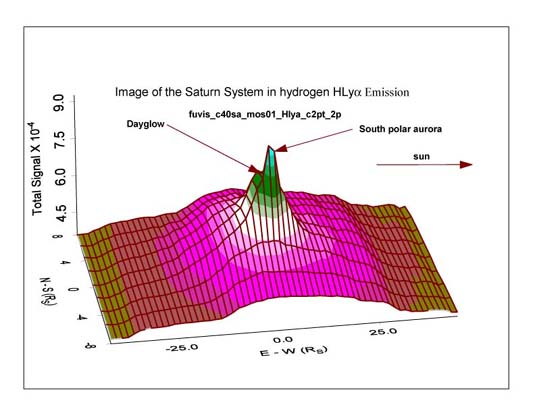 Cassini UVIS Observation of the Saturn System in emission of the atomic hydrogen resonance line (HLya)
The figure shows the distribution of atomic hydrogen emission in the Saturn system obtained using the UVIS FUV imaging spectrometer experiment. The observations provide the first spectral image from the Cassini Observatory Period. The data was accumulated December 25, 2003 through January 6, 2004, at an average range of 85 Mkm from Saturn. The image definitively establishes the distribution of atomic hydrogen in the magnetosphere as a vast mass distributed asymmetrically in local time. The (false) view shown in the image is from above the South Pole with local west to the right. The sub-spacecraft point on Saturn was 20° S latitude and 62° solar phase angle. The sunlit atmosphere is on the right side of the figure. The primary properties of the distribution evident in the image are the extremely broad distribution in the orbital plane measurable to at least 45 Saturn radii from planet to center (Rs), and the extreme extent in latitude evidently significantly beyond 8 Rs above and below the poles. The distributional asymmetry and increasing abundance toward the planet is indicative of a source of energetic hydrogen at the top of the Saturn atmosphere. The abundance shows a sharp shelf on the western side at 25 Rs approximately at the location of the solar wind bow shock. This may be an indication of a cold out-flowing hydrogen component from Titan. In this view, there is no sign of the presence of an orbiting torus of hydrogen gas. A complete determination of distribution will require observations from different lines of sight, to be obtained later in the Saturn Tour. The signal shows a peak at the south pole of the planet, generated by auroral precipitation. A secondary peak appears from the dayglow in the sunlit atmosphere. The emission from the magnetosphere is caused by fluorescence of solar radiation. The pixel spatial resolution is 1.4 Rs in the east-west direction, and 2. Rs (interpolated) in the north-south direction.
Jupiter Flyby
On 1 October 2000, the NASA/ESA Cassini spacecraft on its way to Saturn started observations of the planet Jupiter. The first data from the Ultraviolet Imaging Spectrograph (UVIS) clearly showed the planet’s aurora and a glowing ring of gas ejected from Jupiter’s moon Io. This donut of atoms is known as the Io torus.
The UVIS images show multiple overlapping exposures of this torus, each in the characteristic light emitted by sulfur and oxygen atoms. All of these emissions are invisible to the naked eye and can only be seen in the ultraviolet light that the CU telescopes detect. We see the entire donut of glowing gas in all its invisible colors.

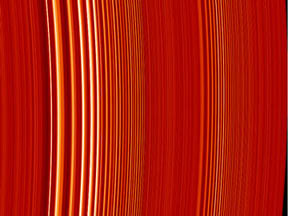
One Day in the Life of Jupiter’s Io Torus.
The above image is the sum of extreme ultraviolet images taken on Tuesday, 14 November 2000, when Cassini was 27 million miles (or 618 Jupite radii) from Jupiter. The Cassini spacecraft stared at Jupiter for an entire rotation of its atmosphere, that is, one Jupiter “day.” Each vertical line shows one type of ionized atom in the Io plasma torus. Shorter wavelengths are on the left and longer on the right. The strongest signals (white) are seen in emissions from ionized oxygen and sulfur atoms. The Jupiter auroral emissions from molecular hydrogen form a central horizontal band on the right; they are dense enough to appear as a structured continuum.
MOVIE
Click here to play a movie of the Io torus as observed on 11 November 2000. Because the atoms giving off the light are trapped by Jupiter’s tilted magnetic field, the torus wobbles back and forth during the course of a Jupiter day.
MOVIE
In the first two months of observing Jupiter, we saw the Jupiter system significantly larger, with clear brightness variations. The aurora brightness changed daily. A brightness asymmetry was also persistent in our pictures: the sunset (top) portion of the torus was brighter than the sunrise (bottom) portion.
Through March 22, UVIS continued to observe Jupiter, the Io torus, and Jupiter’s moons and aurora as the Cassini spacecraft sped toward Saturn. It will arrive at Saturn on 1 July 2004, drop a European-built probe to land on Saturn’s moon Titan, and observe Saturn and its moons and rings from orbit for at least 4 years.
Publications
The Cassini Ultraviolet Imaging Spectrograph Investigation, accepted for publication in Space Science Reviews.
The Cassini-Huygens mission is a cooperative project of NASA, the European Space Agency and the Italian Space Agency. The Jet Propulsion Laboratory, a division of the California Institute of Technology in Pasadena, manages the mission for NASA’s Science Mission Directorate, Washington, D.C. The Cassini orbiter was designed, developed and assembled at JPL. The ultraviolet imaging spectrograph was designed and built at, and the team is based at the University of Colorado, Boulder.