
We’ve been seeing just the tip of the iceberg when monitoring flares with X-rays. With the complete extreme ultraviolet (EUV) coverage by SDO EUV Variability Experiment (EVE), we now see a secondary peak in the EUV that is many minutes after the X-ray flare peak. Furthermore, the total EUV energy from this broad secondary peak has about four times more energy than the EUV energy during the time of the X-ray flare peak. This result is illustrated in the time series plot of the QEUV, being the integrated irradiance from 5 nm to 45 nm that is important for Earth’s ionosphere (plasma in our atmosphere).
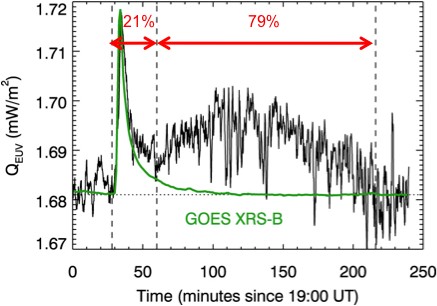
This plot is during the small solar flare (class C2.2) on April 30, 2010. For comparison, the GOES X-ray monitor (XRS-B) is also shown in this plot as the green trace. The QEUV energy during the X-ray flare period is only 21% of the total flare energy; whereas, the energy during the secondary peak is 79%. This result is not unique to this C2.2 flare as we see this secondary peak in all fourteen of the C-class flares that EVE has observed so far.
 Credit: NASA/SDO/EVE/AIA/HMI/R. Hock/LASP
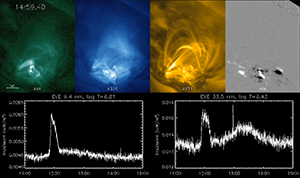
The movie with AIA 33.5 nm images and time series plot of EVE Fe XVI 33.5 nm irradiance (red trace) indicates that many coronal loops get brighter after the X-ray flare peak and at different times and thus produce the broad secondary peak. In this movie, the EVE Fe XX 13.3 nm irradiance (white trace) behaves much like the X-ray time series. We have a lot more to learn about solar flares from the new SDO instruments, but already these EVE results require us to modify how we include solar EUV flares into space weather applications and operations.