Gravity Wave Observations
The observations listed below are being used by WAVE researchers to characterize gravity waves in the atmosphere and understand the state and variability of the atmosphere itself.
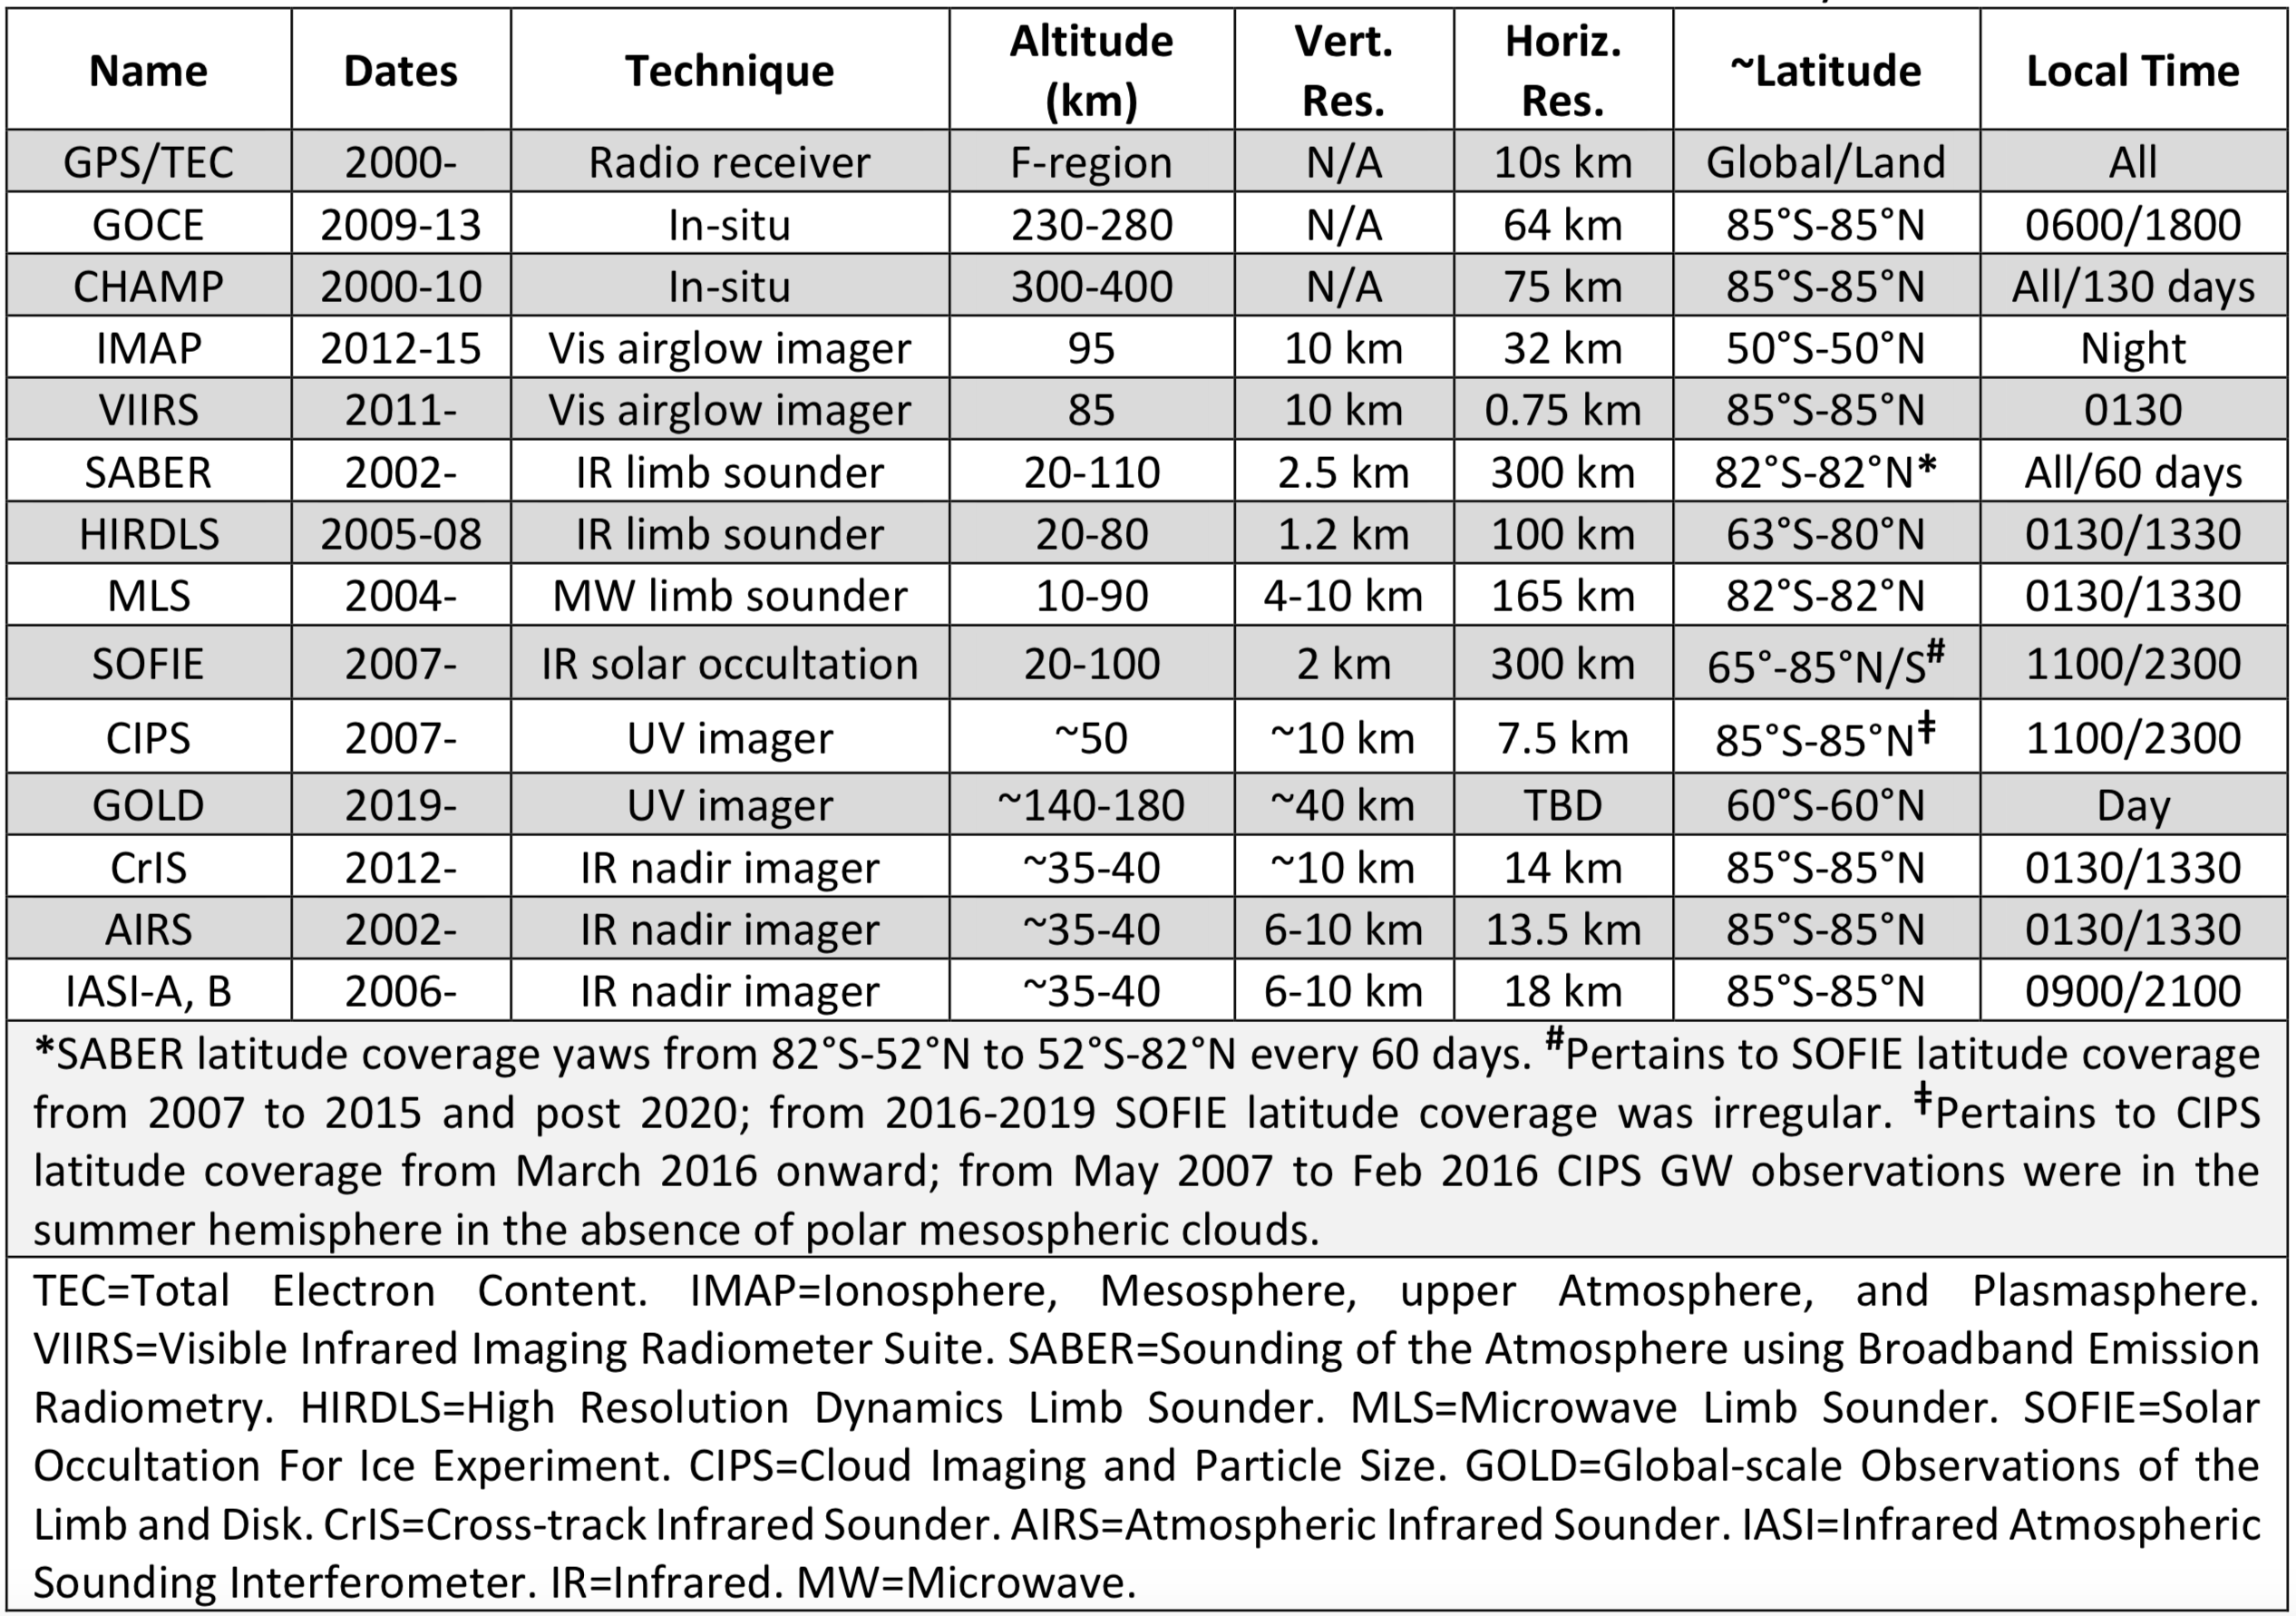
This table lists the gravity wave (GW) measurements currently under consideration. Inclusion of these and other ground-based and newly available measurements are being evaluated for feasibility and effectiveness as part of the Phase I activities. Images from AIRS, CrIS, and IASI areanalyzed to identify GWs in the stratosphere; CIPS and IMAP data extend the range of altitudes to the stratopause and mesopause regions, respectively. Coincident limb-viewing measurements are used to validate our methods for quantifying the momentum and energy fluxes. Two VIIRS Day/Night Band sensors on NOAA and NASA satellites will be analyzed to characterize global GWs with vertical wavelengths longer than 10 km in OH airglow at ~85 km. Additional thermosphere-ionosphere GW observations (CHAMP, GOLD, GOCE, GPS/TEC) are used to extend our advanced GW analyses to higher altitudes.

This schematic gives the altitudes and date ranges for the GW observational datasets currently being used by the WAVE team.
CIPS
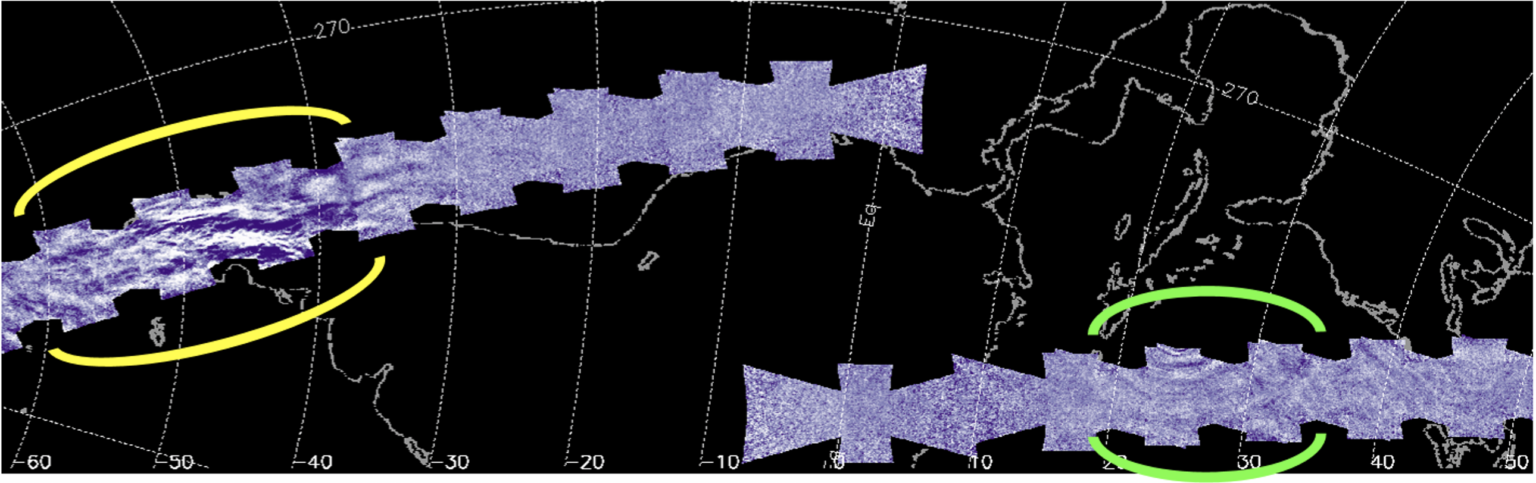
Figure Caption: This image shows gravity waves in the lowermost mesosphere on 30 August 2019, measured by the NASA Aeronomy of Ice in the Mesosphere (AIM) Cloud Imaging and Particle Size instrument (CIPS). The intricate wave patterns highlighted in yellow were generated by wind flow over the Andes mountains. The concentric waves highlighted in green were generated by Hurricane Dorian. CIPS observations, measurements by other instruments at different altitudes, and models are used by the WAVE team to understand the propagation and evolution of gravity waves. These investigations reveal how weather at the surface impacts the ionosphere.
3D Gravity Waves Observed by AIRS
Movie Caption: Three-dimensional measurements of temperature perturbations due to gravity waves over the southern Andes mountains (left) and the island of South Georgia (right) from the AIRS instrument aboard NASA’s Aqua satellite. During winter, strong winds force these waves high into the stratosphere. These observations extend from 20 km to 60 km altitude (Courtesy of Neil Hindley, U. Bath, UK).
Atmospheric Observations
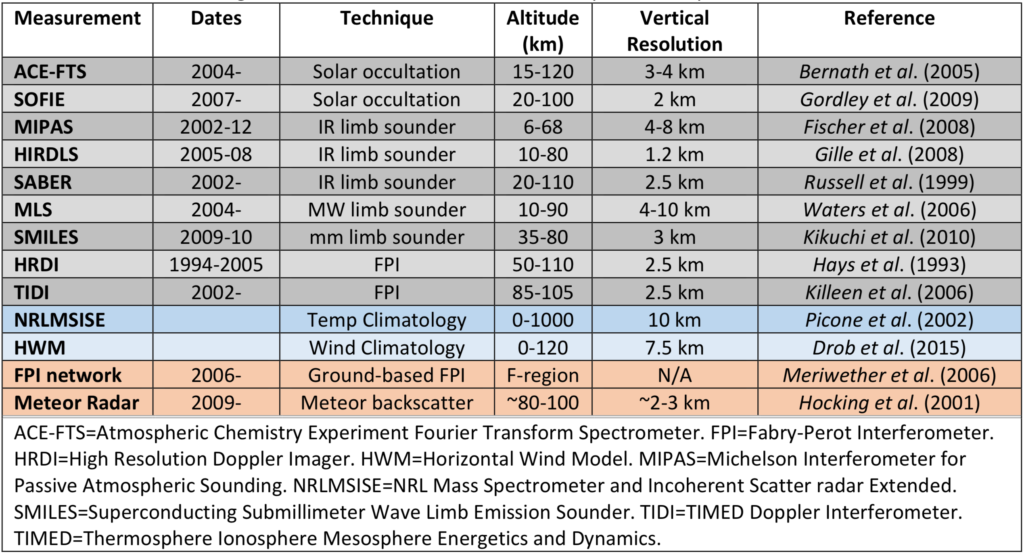
This table lists the observations that will be used to 1) evaluate the models and 2) to diagnose the background atmosphere through which gravity waves (GWs) propagate, which is necessary to infer GW vertical wavelength and for ray tracing calculations.