| Image/Graphic | Title/Description | Release date | Format (Size) |
|---|---|---|---|
|
|
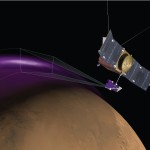
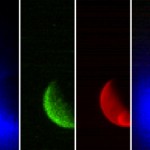
IUVS observations of a proton aurora |
July 23, 2018 |
GIF (10 MB) |
|
|
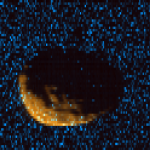
The Martian atmosphere during a proton aurora |
July 23, 2018 |
GIF (580 KB) |
|
|
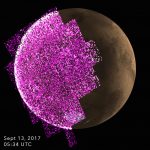
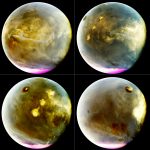
Solar Storm Triggers Whole-Planet Aurora at Mars |
Sept. 29, 2017 |
JPG (1.7 MB) |
|
|
Sun Storm Triggers Whole-Planet Aurora at Mars (Video) |
Sept. 29, 2017 |
GIF (4 MB) |
|
|
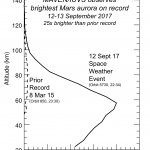
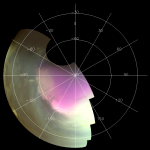
Martian Aurora 25 Times Brighter Than Prior Brightest |
Sept. 29, 2017 |
PNG (219 KB) |
|
|
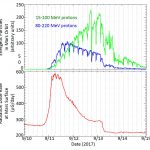
Solar Storm's Radiation at Martian Orbit and Surface |
Sept. 29, 2017 |
JPG (714 KB) |
|
|
IUVS reveals cloud formation on Mars |
Oct. 17, 2016 |
PNG (2 MB) |
|
|
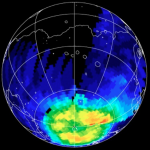
Ultraviolet image of Mars' south pole during southern spring |
Oct. 17, 2016 |
PNG (281 KB) |
|
|
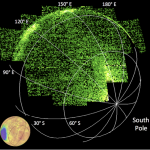
Mars nightside ultraviolet emission from nitric oxide |
Oct. 17, 2016 |
PNG (3 MB) |
|
|
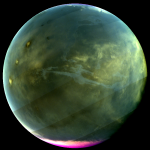
IUVS captures sharpened ultraviolet view of Mars |
Oct. 3, 2016 |
PNG (704 KB) |
|
|
Phobos as observed by MAVEN IUVS |
Feb. 29, 2016 |
PNG (119 KB) |
|
|
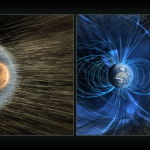
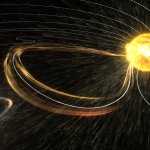
The solar wind at Mars and Earth |
Nov. 5, 2015 |
PNG (11 MB) |
|
|
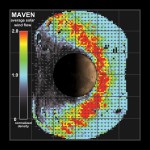
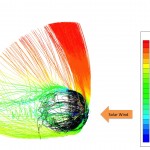
Observed average solar wind flow at Mars |
Nov. 5, 2015 |
JPG (9 MB) |
|
|
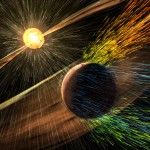
Mars in the path of a solar storm |
Nov. 5, 2015 |
PNG (10 MB) |
|
|
Mars solar storm ion loss |
Nov. 5, 2015 |
JPG (10 MB) |
|
|
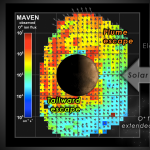
Observed O+ ion flux chart |
Nov. 5, 2015 |
PNG (4 MB) |
|
|
Computer simulation of Mars' polar plume |
June 19, 2015 |
JPG (430 KB) |
|
|
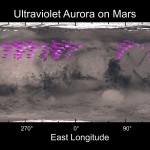
IUVS Observes the "Christmas lights aurora" on Mars |
Mar. 18, 2015 |
JPG (211 KB) |
|
|
IUVS Map of Ultraviolet Aurora on Mars |
Mar. 18, 2015 |
JPG (635 KB) |
|
|
LPW Observes Dust in Mars Upper Atmosphere |
Mar. 18, 2015 |
PNG (142 KB) |
|
|
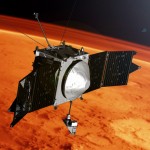
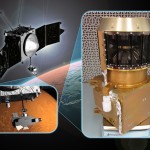
MAVEN Spacecraft Carrying Out Science Operations at Mars |
Dec. 15, 2014 |
JPG (329 KB) |
|
|
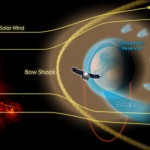
The Solar Wind and its Interaction with Mars’ Ionosphere |
Dec. 15, 2014 |
JPG (466 KB) |
|
|
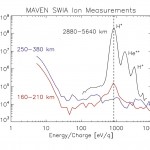
MAVEN SWIA Ion Measurements |
Dec. 15, 2014 |
JPG (683 KB) |
|
|
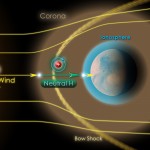
Deep Penetration of Neutralized Solar Wind Ions |
Dec. 15, 2014 |
JPG (312 KB) |
|
|
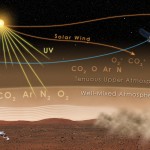
Mars Atmospheric Reservoirs |
Dec. 15, 2014 |
JPG (645 KB) |
|
|
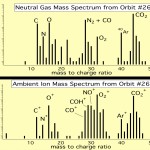
MAVEN NGIMS Mass Spectrum |
Dec. 15, 2014 |
JPG (746 KB) |
|
|
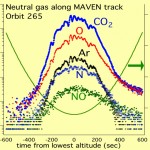
NGIMS Measurements of Neutrals During One Orbit |
Dec. 15, 2014 |
JPG (828 KB) |
|
|
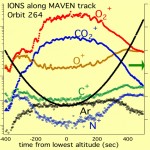
NGIMS Measurements of Ions During One Orbit |
Dec. 15, 2014 |
JPG (790 KB) |
|
|
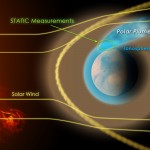
STATIC Instrument on the MAVEN Spacecraft |
Dec. 15, 2014 |
JPG (641 KB) |
|
|
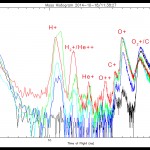
Sample Spectra from MAVEN STATIC Instrument |
Dec. 15, 2014 |
JPG (865 KB) |
|
|
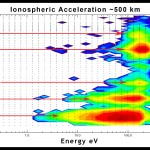
STATIC Measurements of Composition and Energy of Ions |
Dec. 15, 2014 |
JPG (2 MB) |
|
|
STATIC Measures Escaping Polar Plume of Ions |
Dec. 15, 2014 |
JPG (412 KB) |
|
|
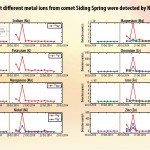
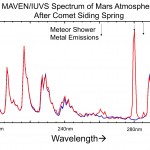
Ions of Eight Metals from Comet Dust Detected in Mars Atmosphere |
Nov. 7, 2014 |
JPG (3 MB) |
|
|
Comet Put Magnesium and Iron into Martian Atmosphere |
Nov. 7, 2014 |
JPG (651 KB) |
|
|
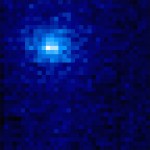
Ultraviolet Image of Comet Siding Spring’s Hydrogen Coma |
Oct. 23, 2014 |
JPG (836 KB) |
|
|
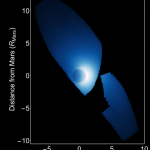
IUVS observation of atomic hydrogen |
Oct. 14, 2014 |
PNG (128 KB) |
|
|
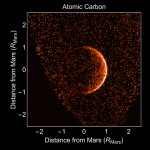
IUVS observation of atomic carbon |
Oct. 14, 2014 |
PNG (293 KB) |
|
|
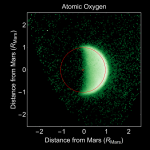
IUVS observation of atomic oxygen |
Oct. 14, 2014 |
PNG (194 KB) |
|
|
IUVS observation of Mars' ozone column |
Oct. 14, 2014 |
PNG (583 KB) |
|
|
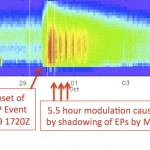
First SEP event observations |
Oct. 14, 2014 |
PNG (226 KB) |
|
|
ENLIL model of Sept. 26, 2014 CME |
Oct. 14, 2014 |
GIF (1.0 MB) |
|
|
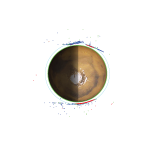
IUVS first light |
Sept. 23, 2014 |
JPG (479 KB) |

Main Menu