
Trajectory Information
Voyager – Trajectory Information
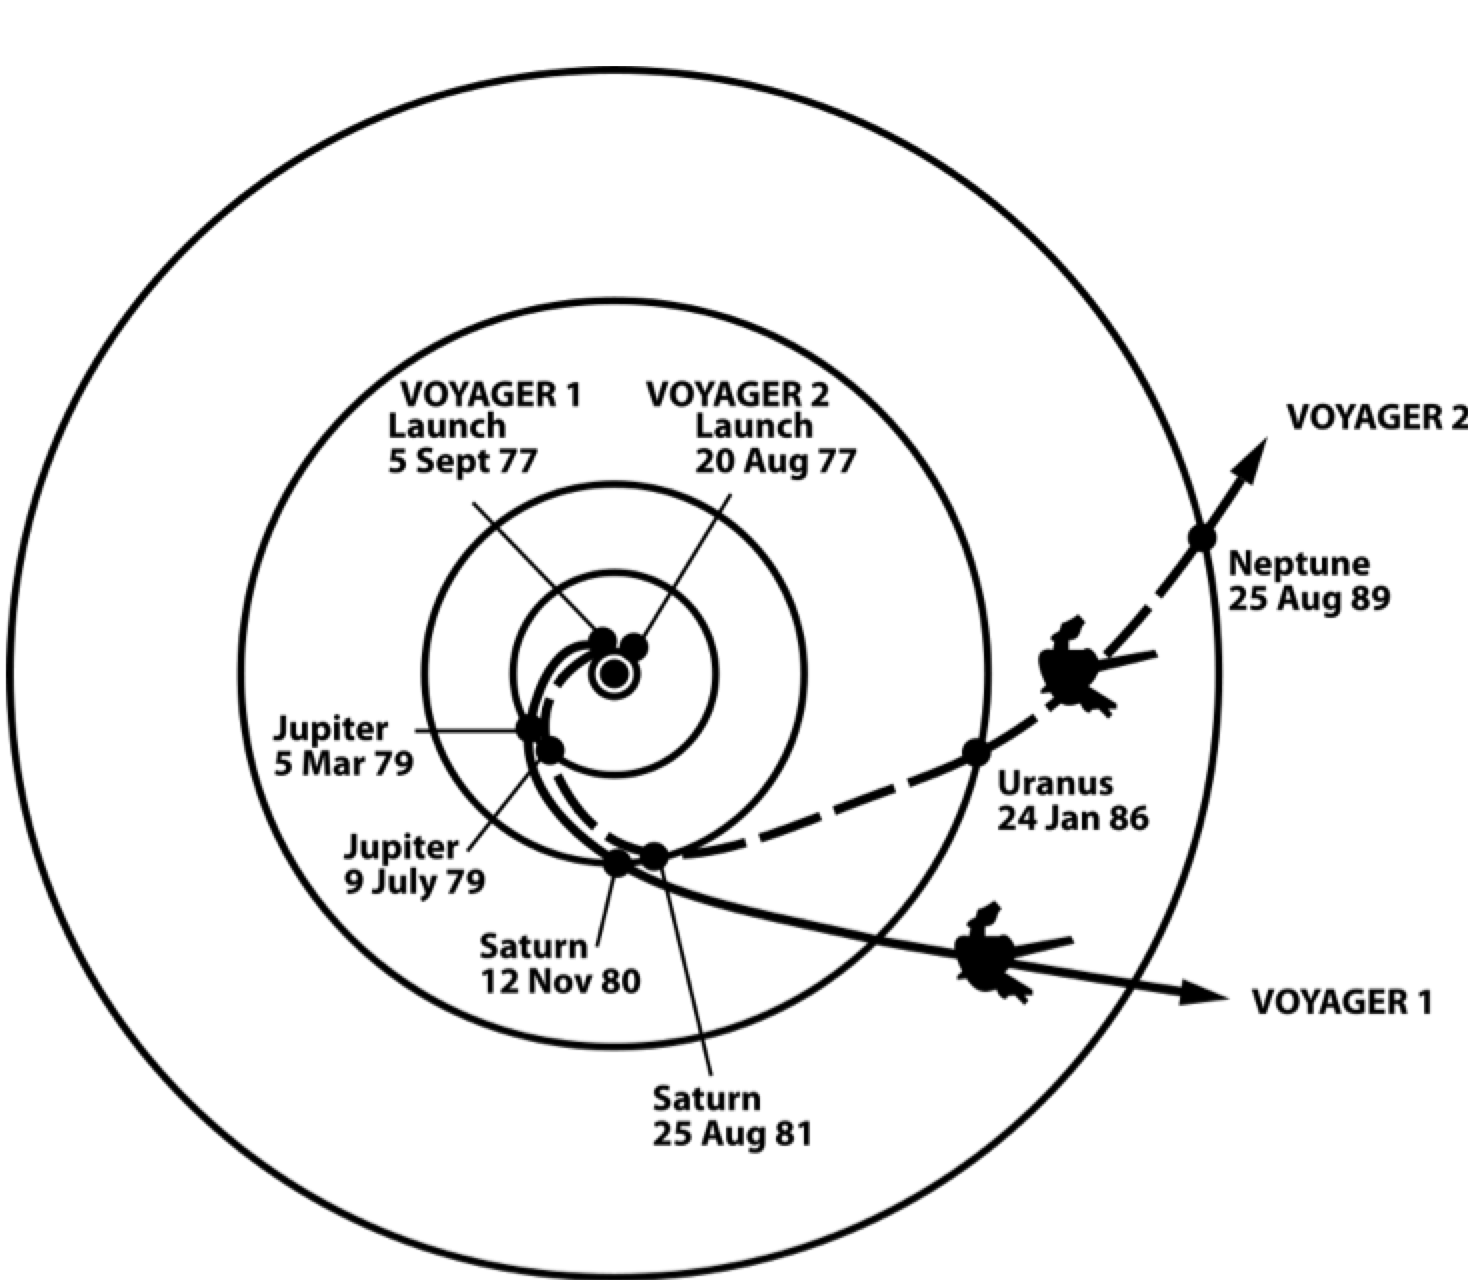
The Voyager 1 & 2 spacecraft were launched in fall 1977 and reached Jupiter two years later. Their trajectories through the jovian system are shown here (from McNutt et al. 1981)
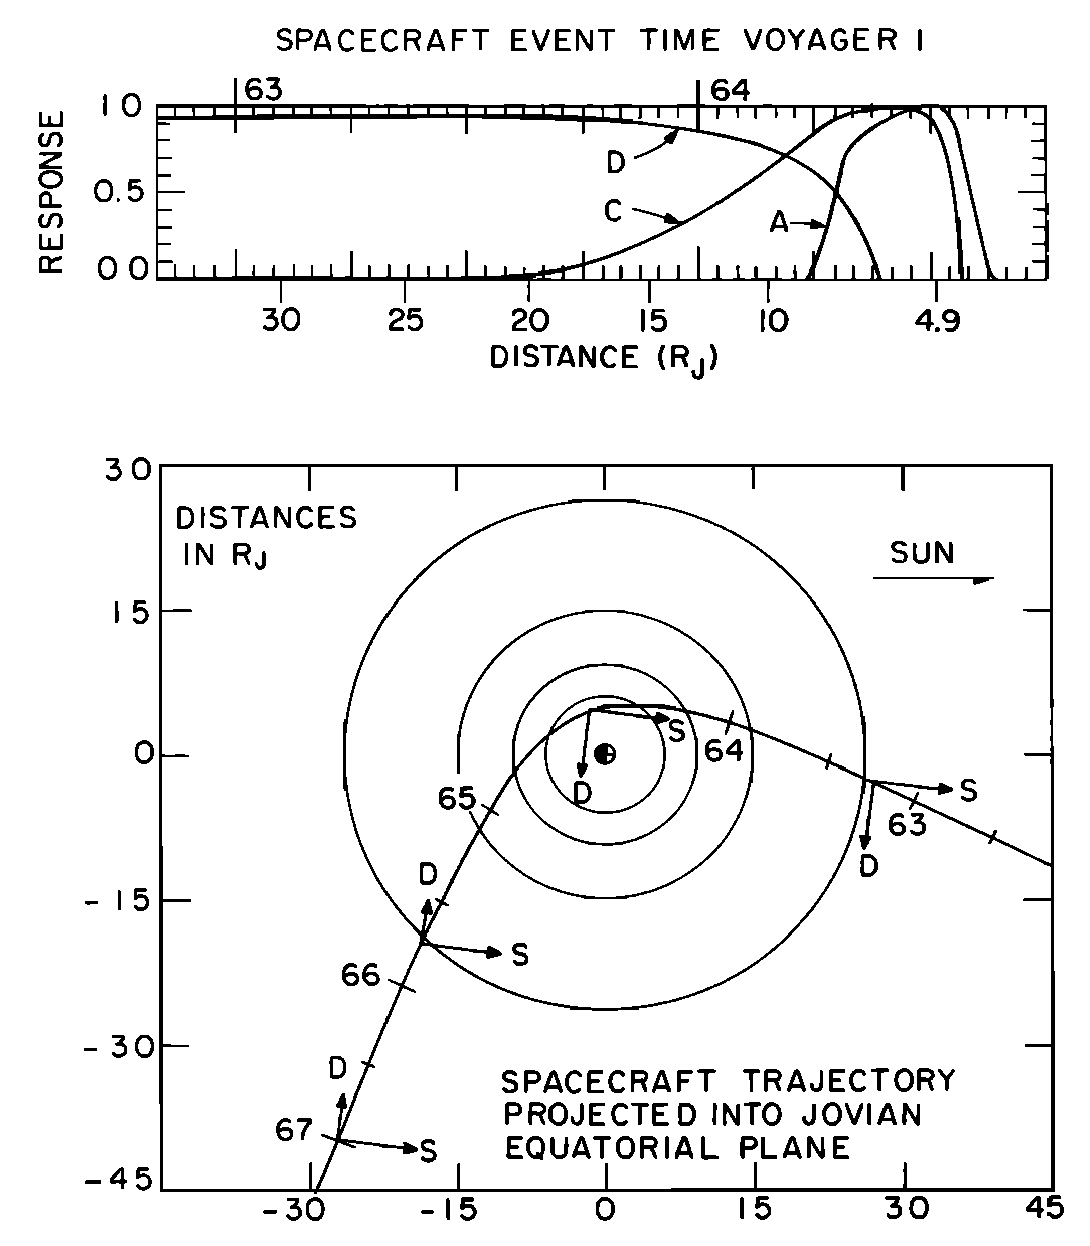 |
The trajectory of the voyager 1 spacecraft can be seen to the left. (Click image for full size) |
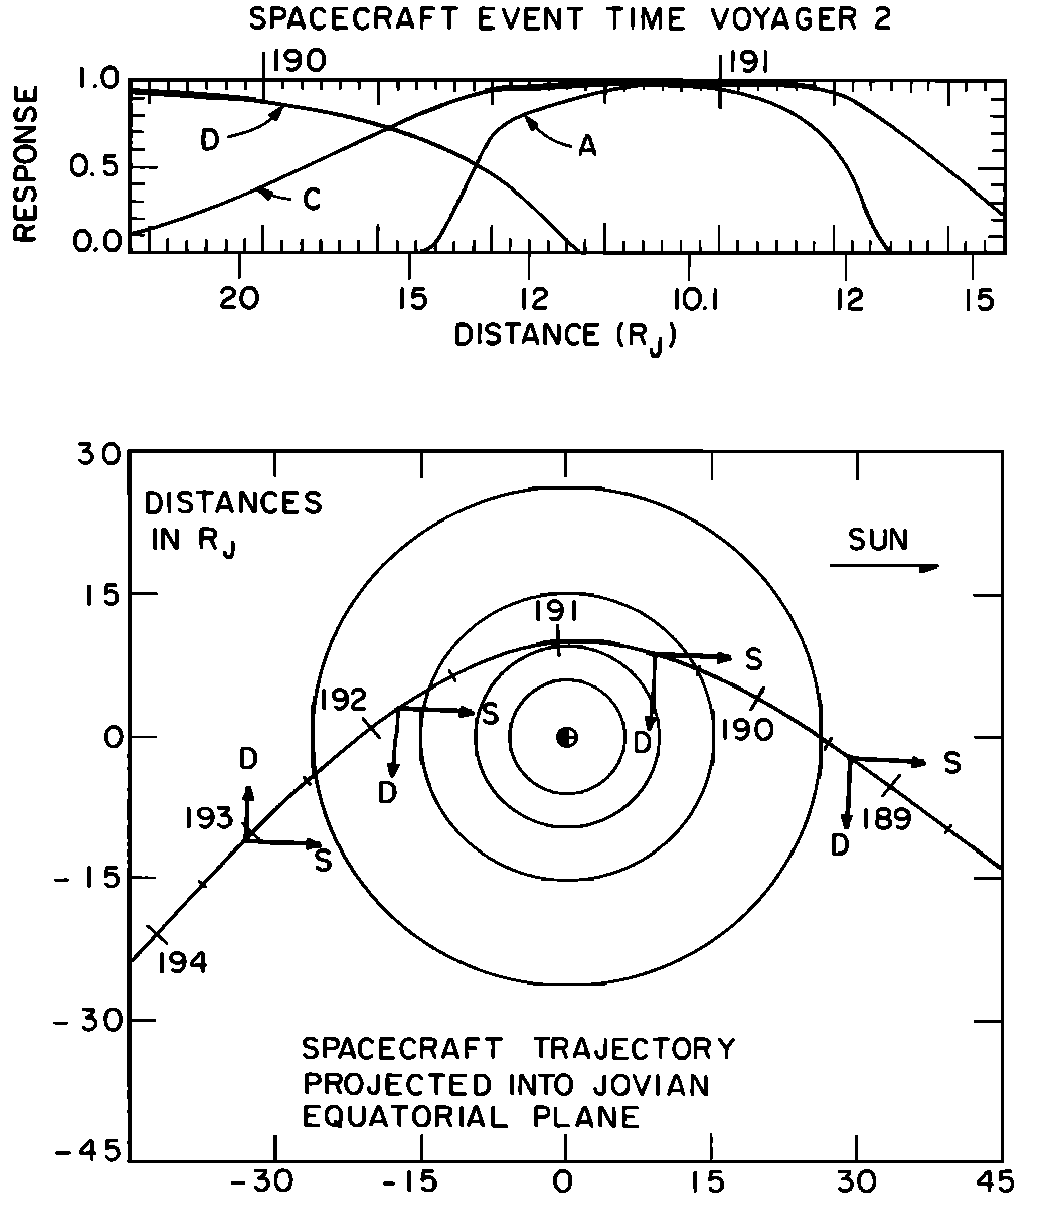 |
The trajectory of the voyager 2 spacecraft can be seen to the left. (Click image for full size) |
 |
The simplest method of obtaining trajectory information for Voyager (and other outer solar system missions) is via the University of Iowa ephemeris site. (Click image for full size) |
 |
To find out more about there Hyberbolic Orbital Elements – for each planetary flyby and solar system escape trajectories – look at the JPL website here.
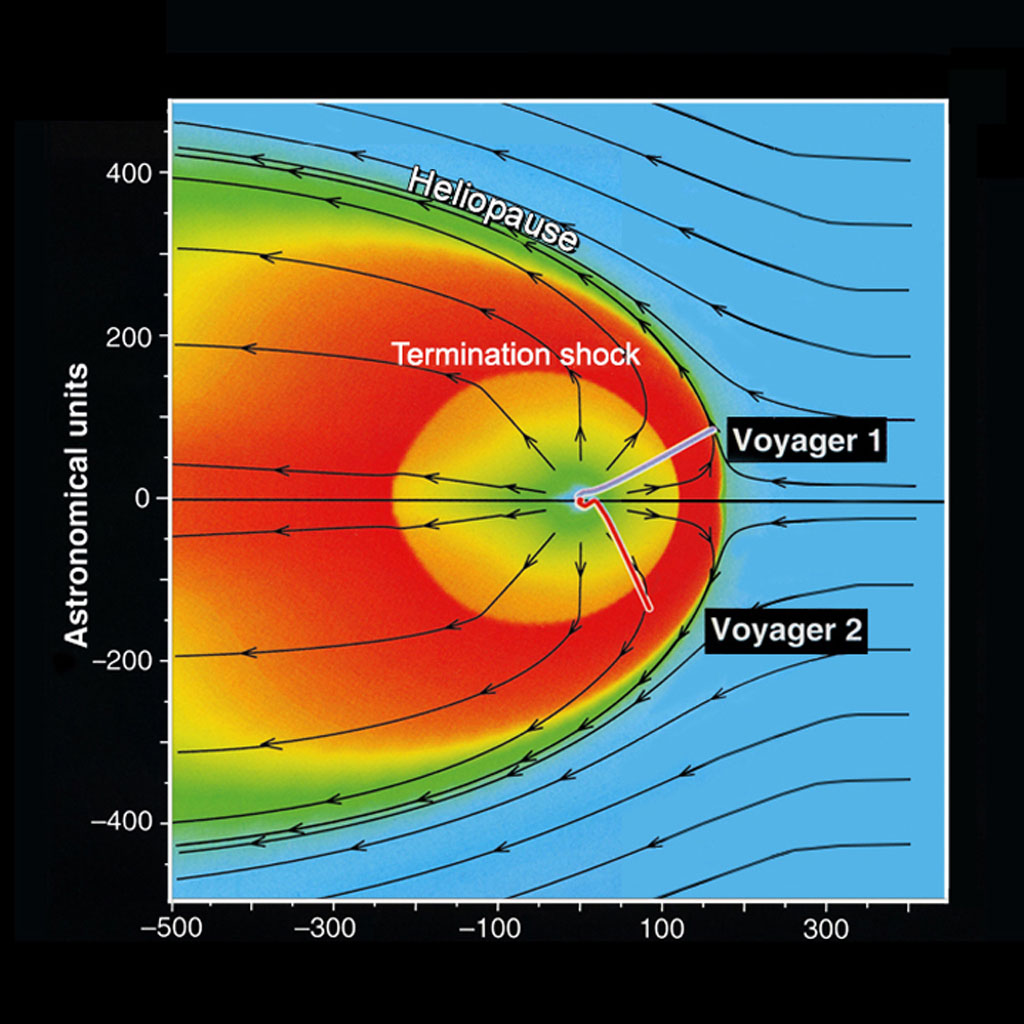
And, then they were off into interplanetary – and then interstellar – space…. site. |
Below contains information regarding the spacecraft location relative to the magnetic field orientation. Documentation can be found here.
The Voyager 1 spacecraft trajectory given a simple dipole model can be found here.
The Voyager 2 spacecraft trajectory given a simple dipole model can be found here.
Field line mapping. Below are plots describing the Voyager 1 trajectory through the magnetic field produced by the VIP4 + CAN model. Output information can be found here for Voyager 1, and here for Voyager 2.
The plot to the left shows the radial separation between the location of the centrifugal equator and the Voyager 2 spacecraft as it traverses the magnetic field structure of Jupiter. Where the curve is blue, the spacecraft is traveling inbound while the grey portion of the curve represents outbound data.
(Click image for full size)
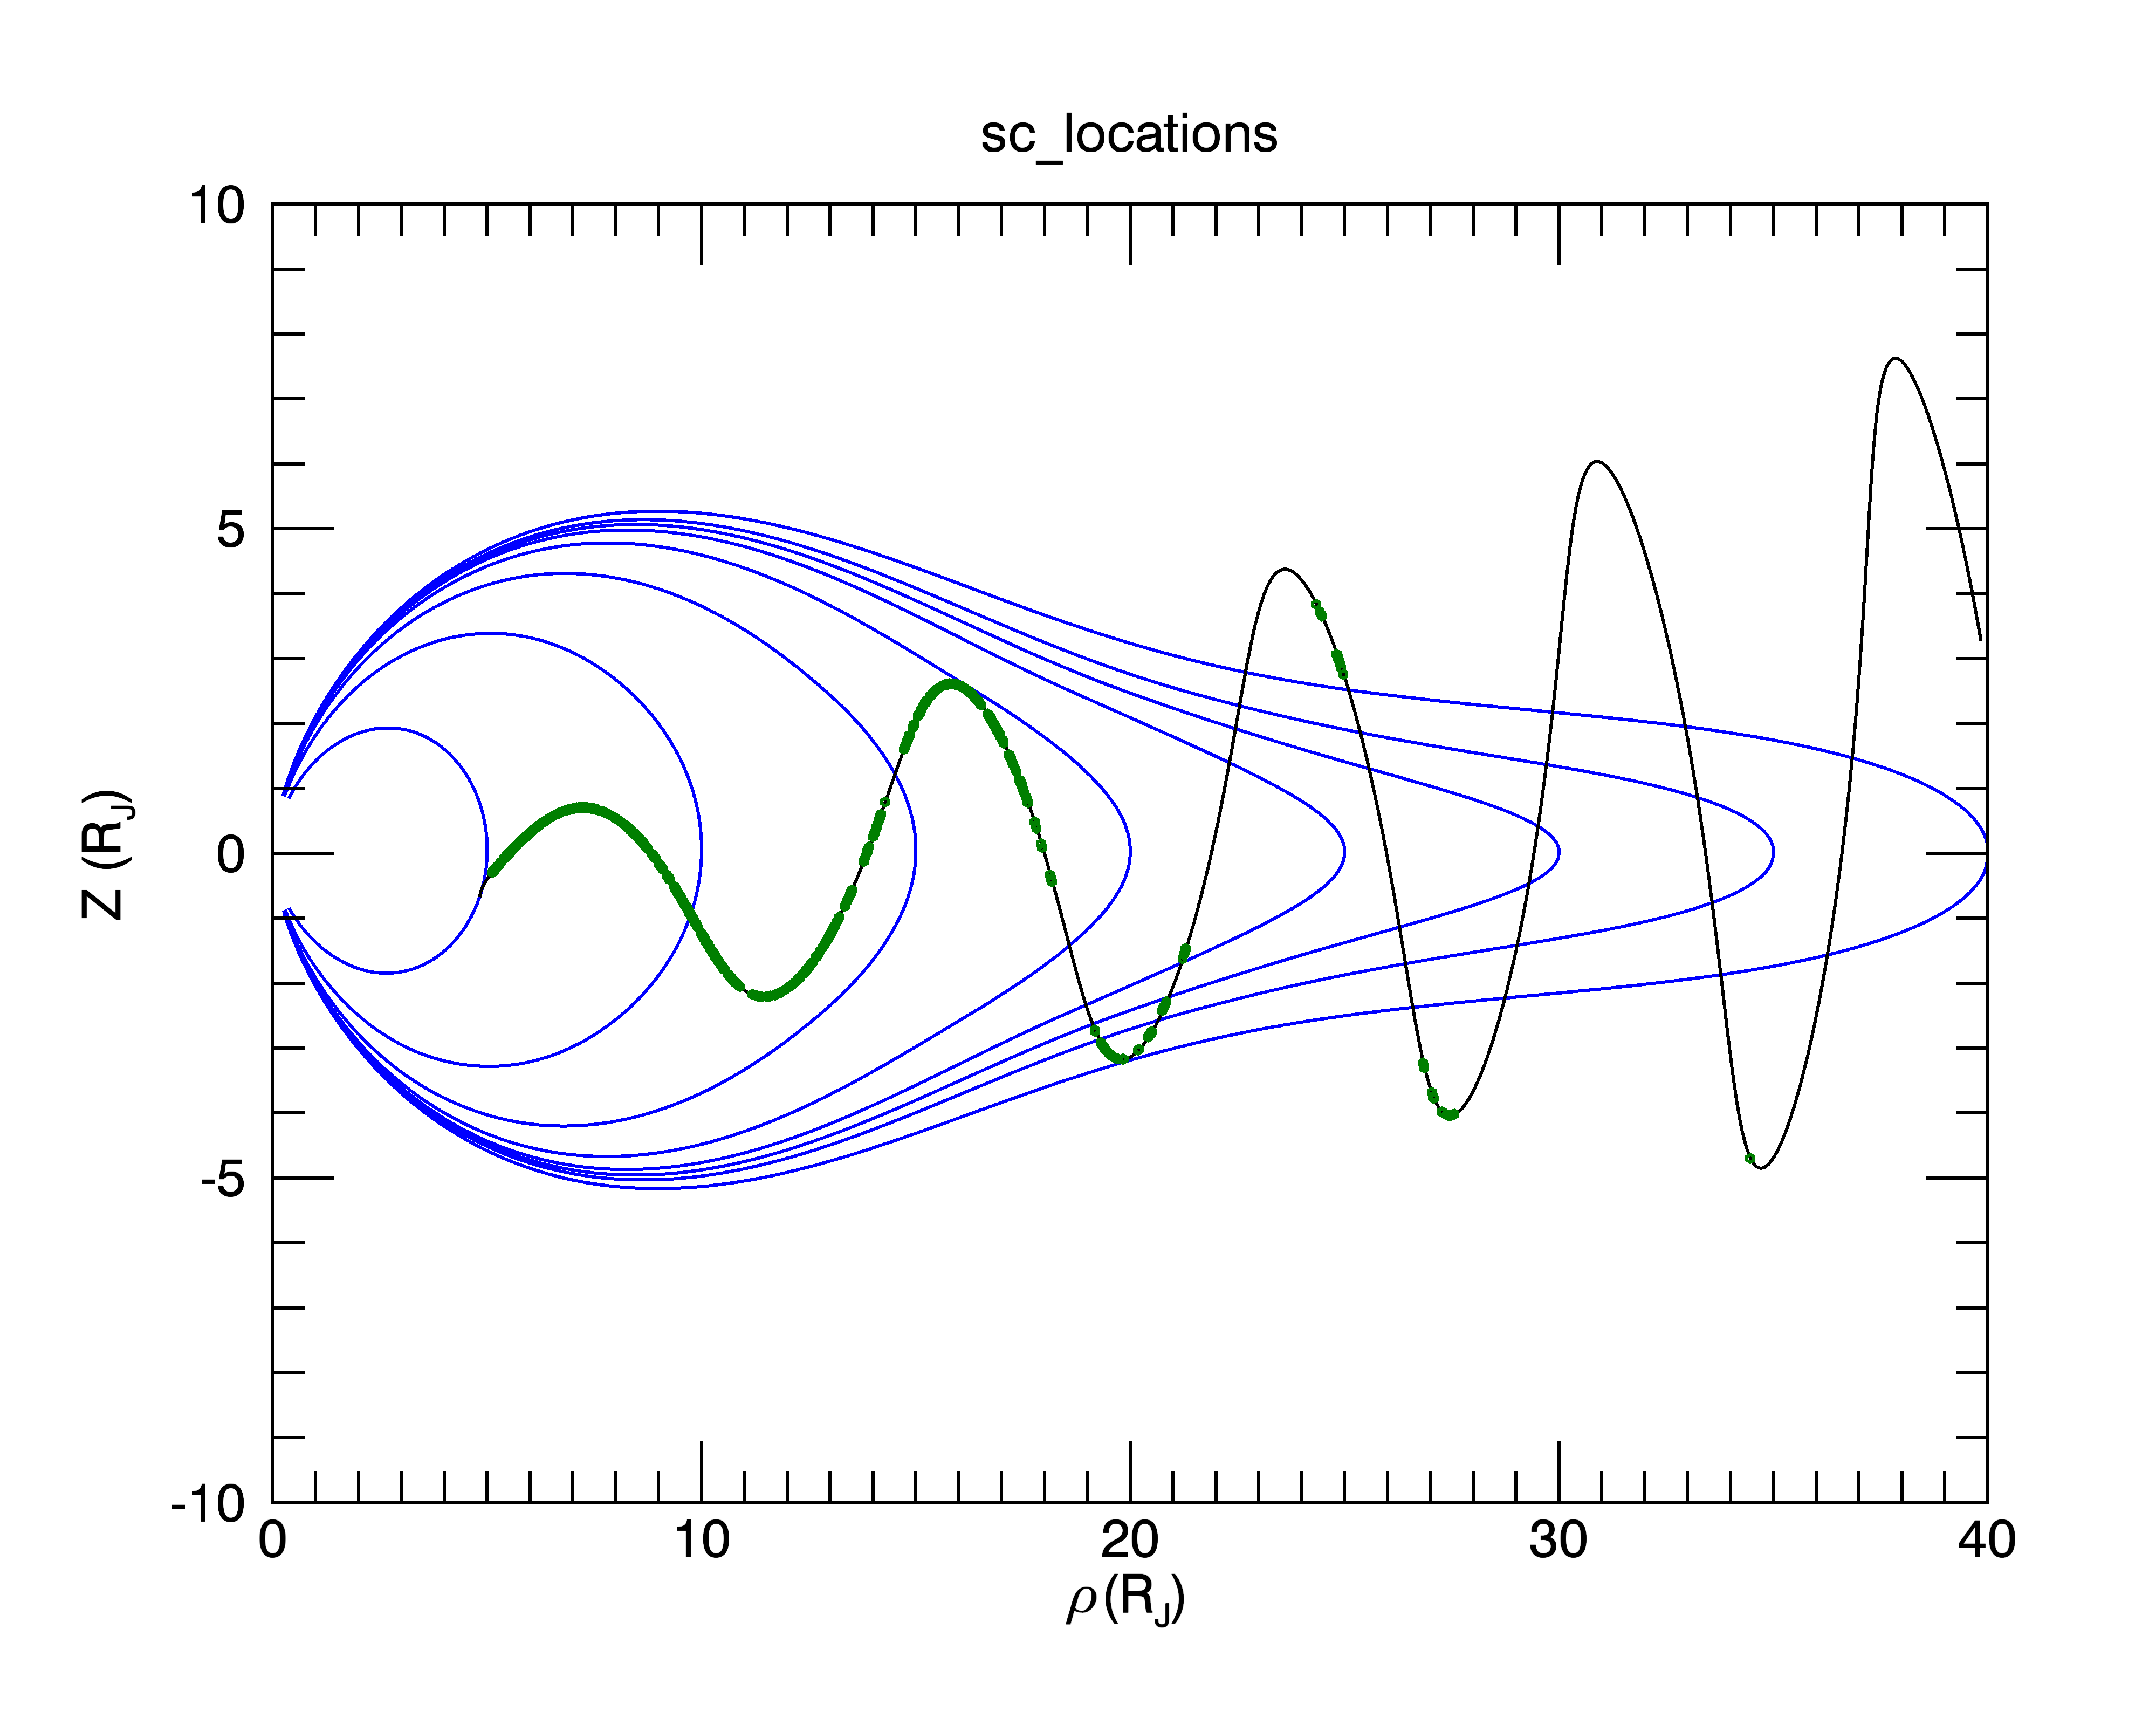 |
The plot to the left shows the inbound trajectory of the Voyager 1 Spacecraft as it travels through the magnetic field structure as defined by the VIP4+CAN model. The x-axis rho is given in magnetic field coordinates. The points where the line have green symbols on top of the black is where the data were analyzed. (Click image for full size) |
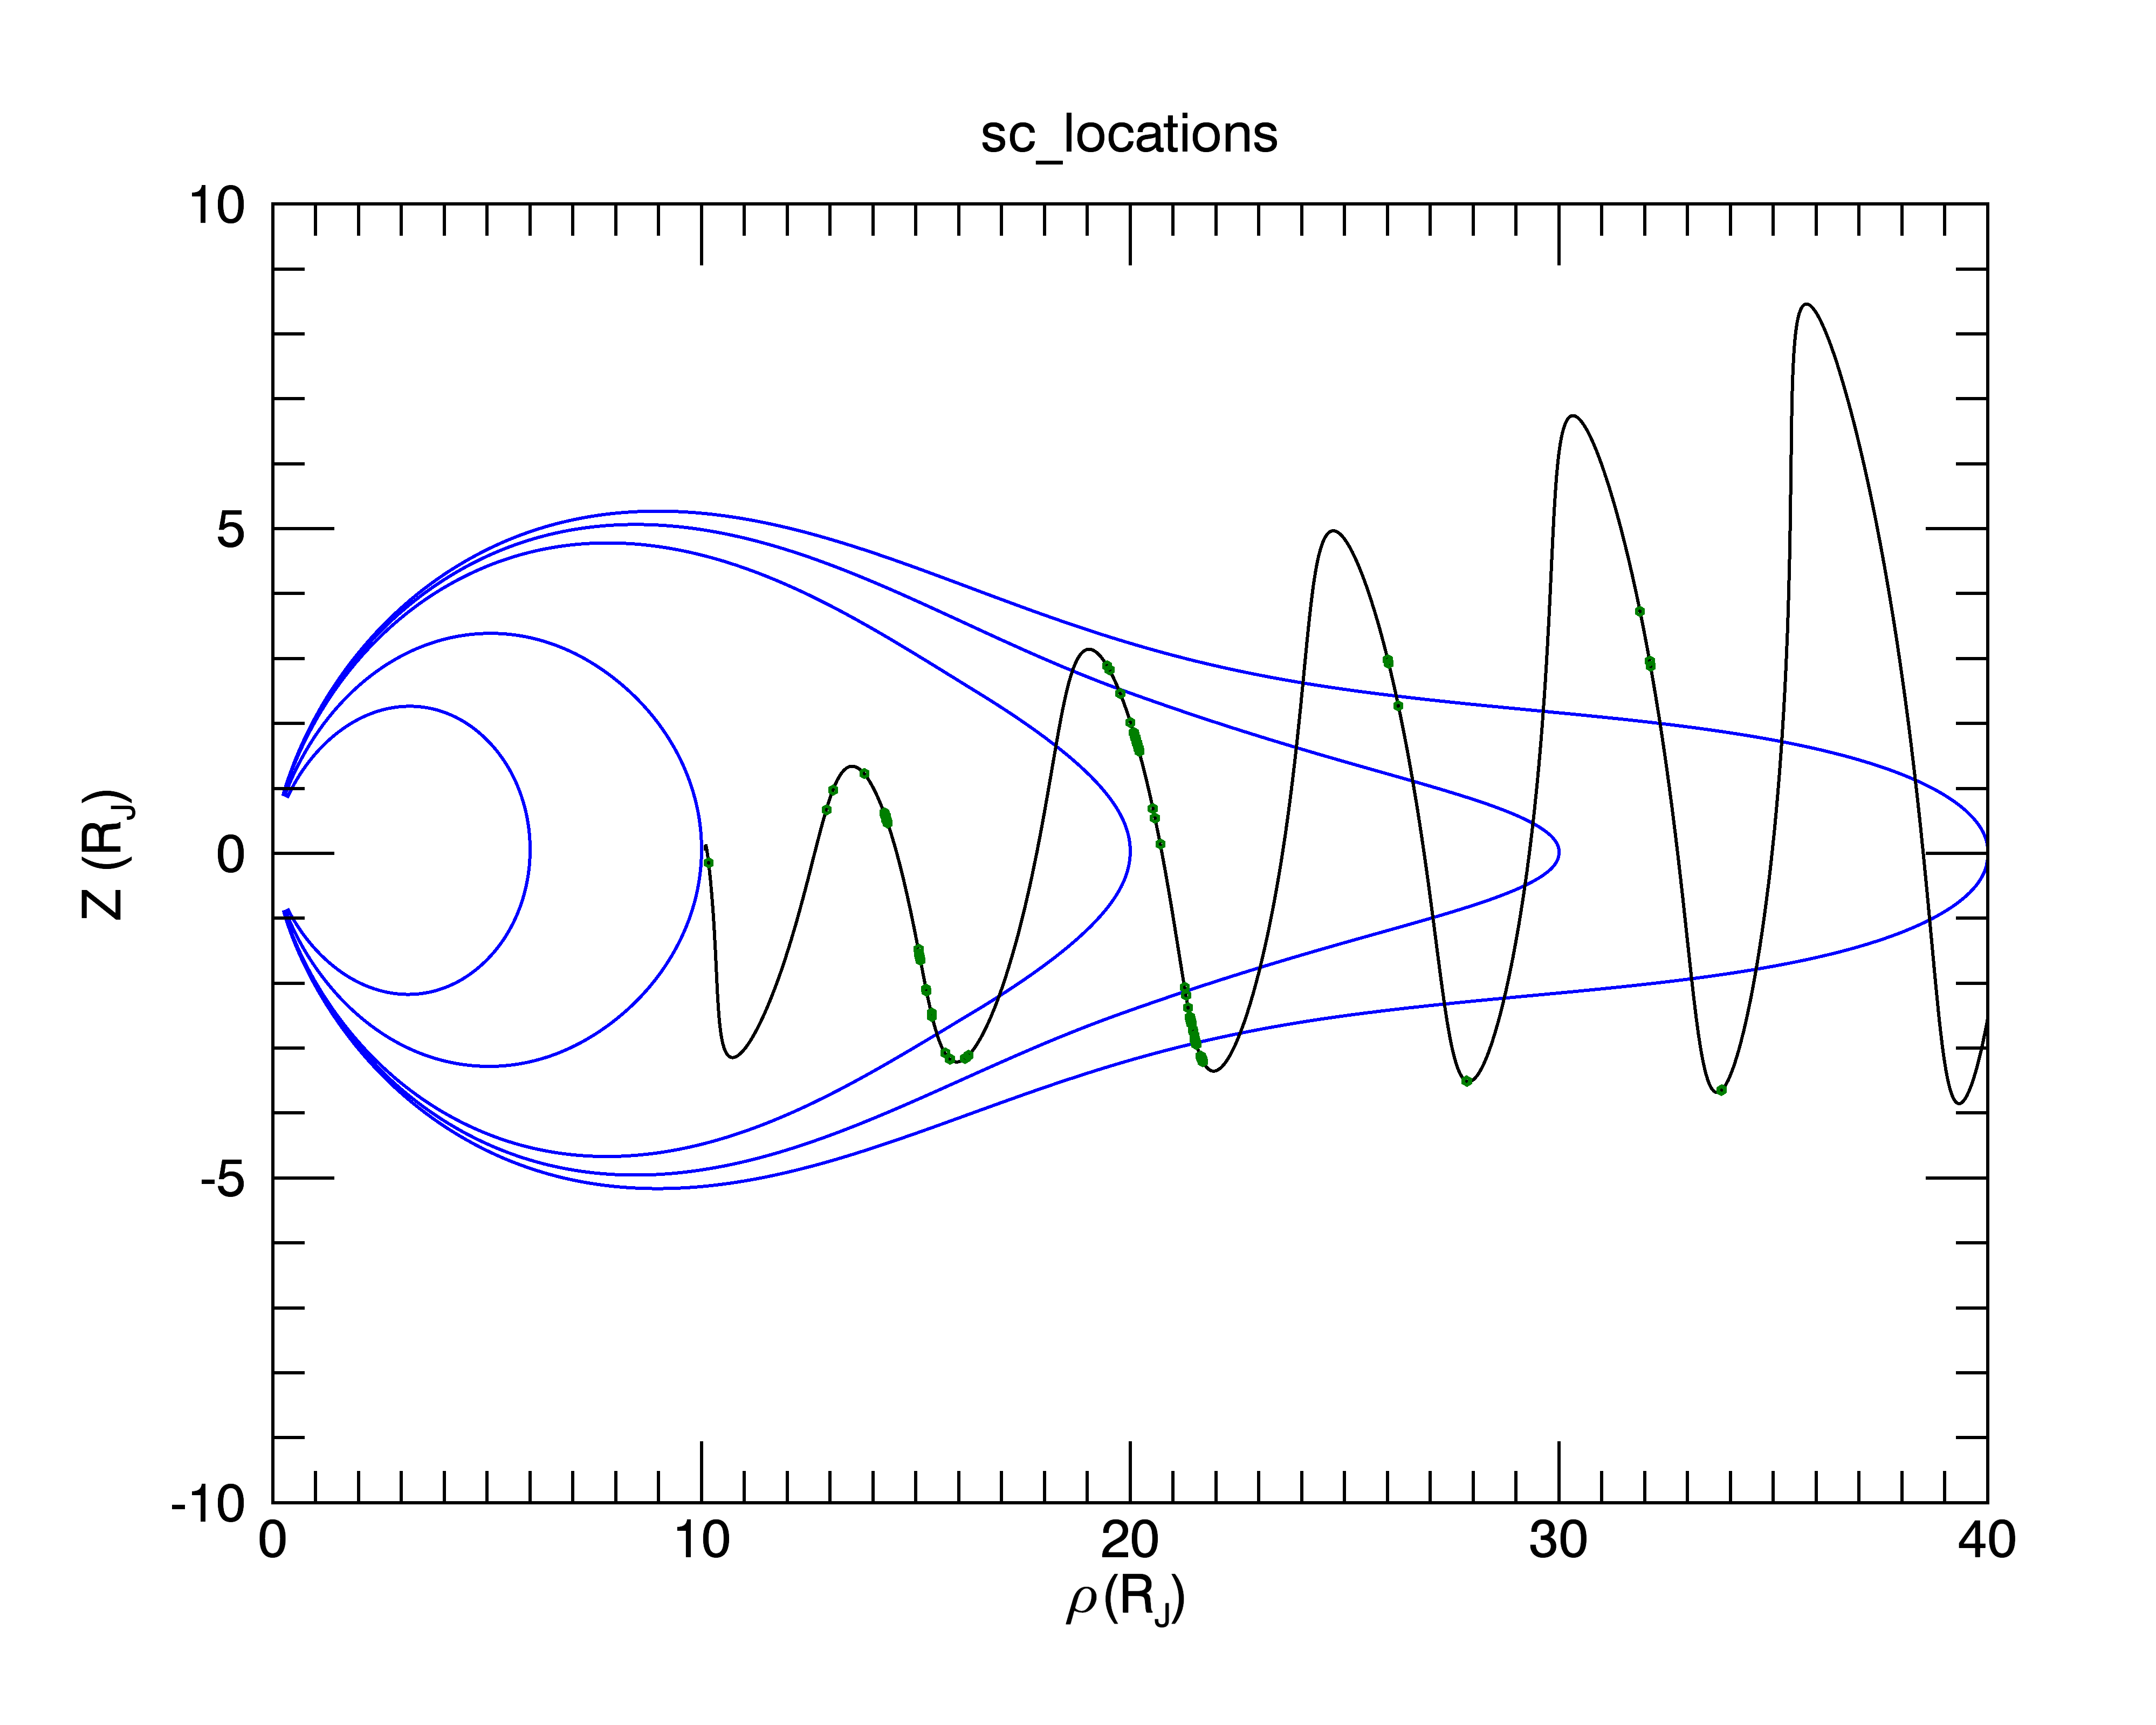 |
The plot to the left shows the inbound trajectory of the Voyager 2 Spacecraft as it travels through the magnetic field structure as defined by the VIP4+CAN model. The x-axis rho is given in magnetic field coordinates. The points where the line have green symbols on top of the black is where the data were analyzed. (Click image for full size) |
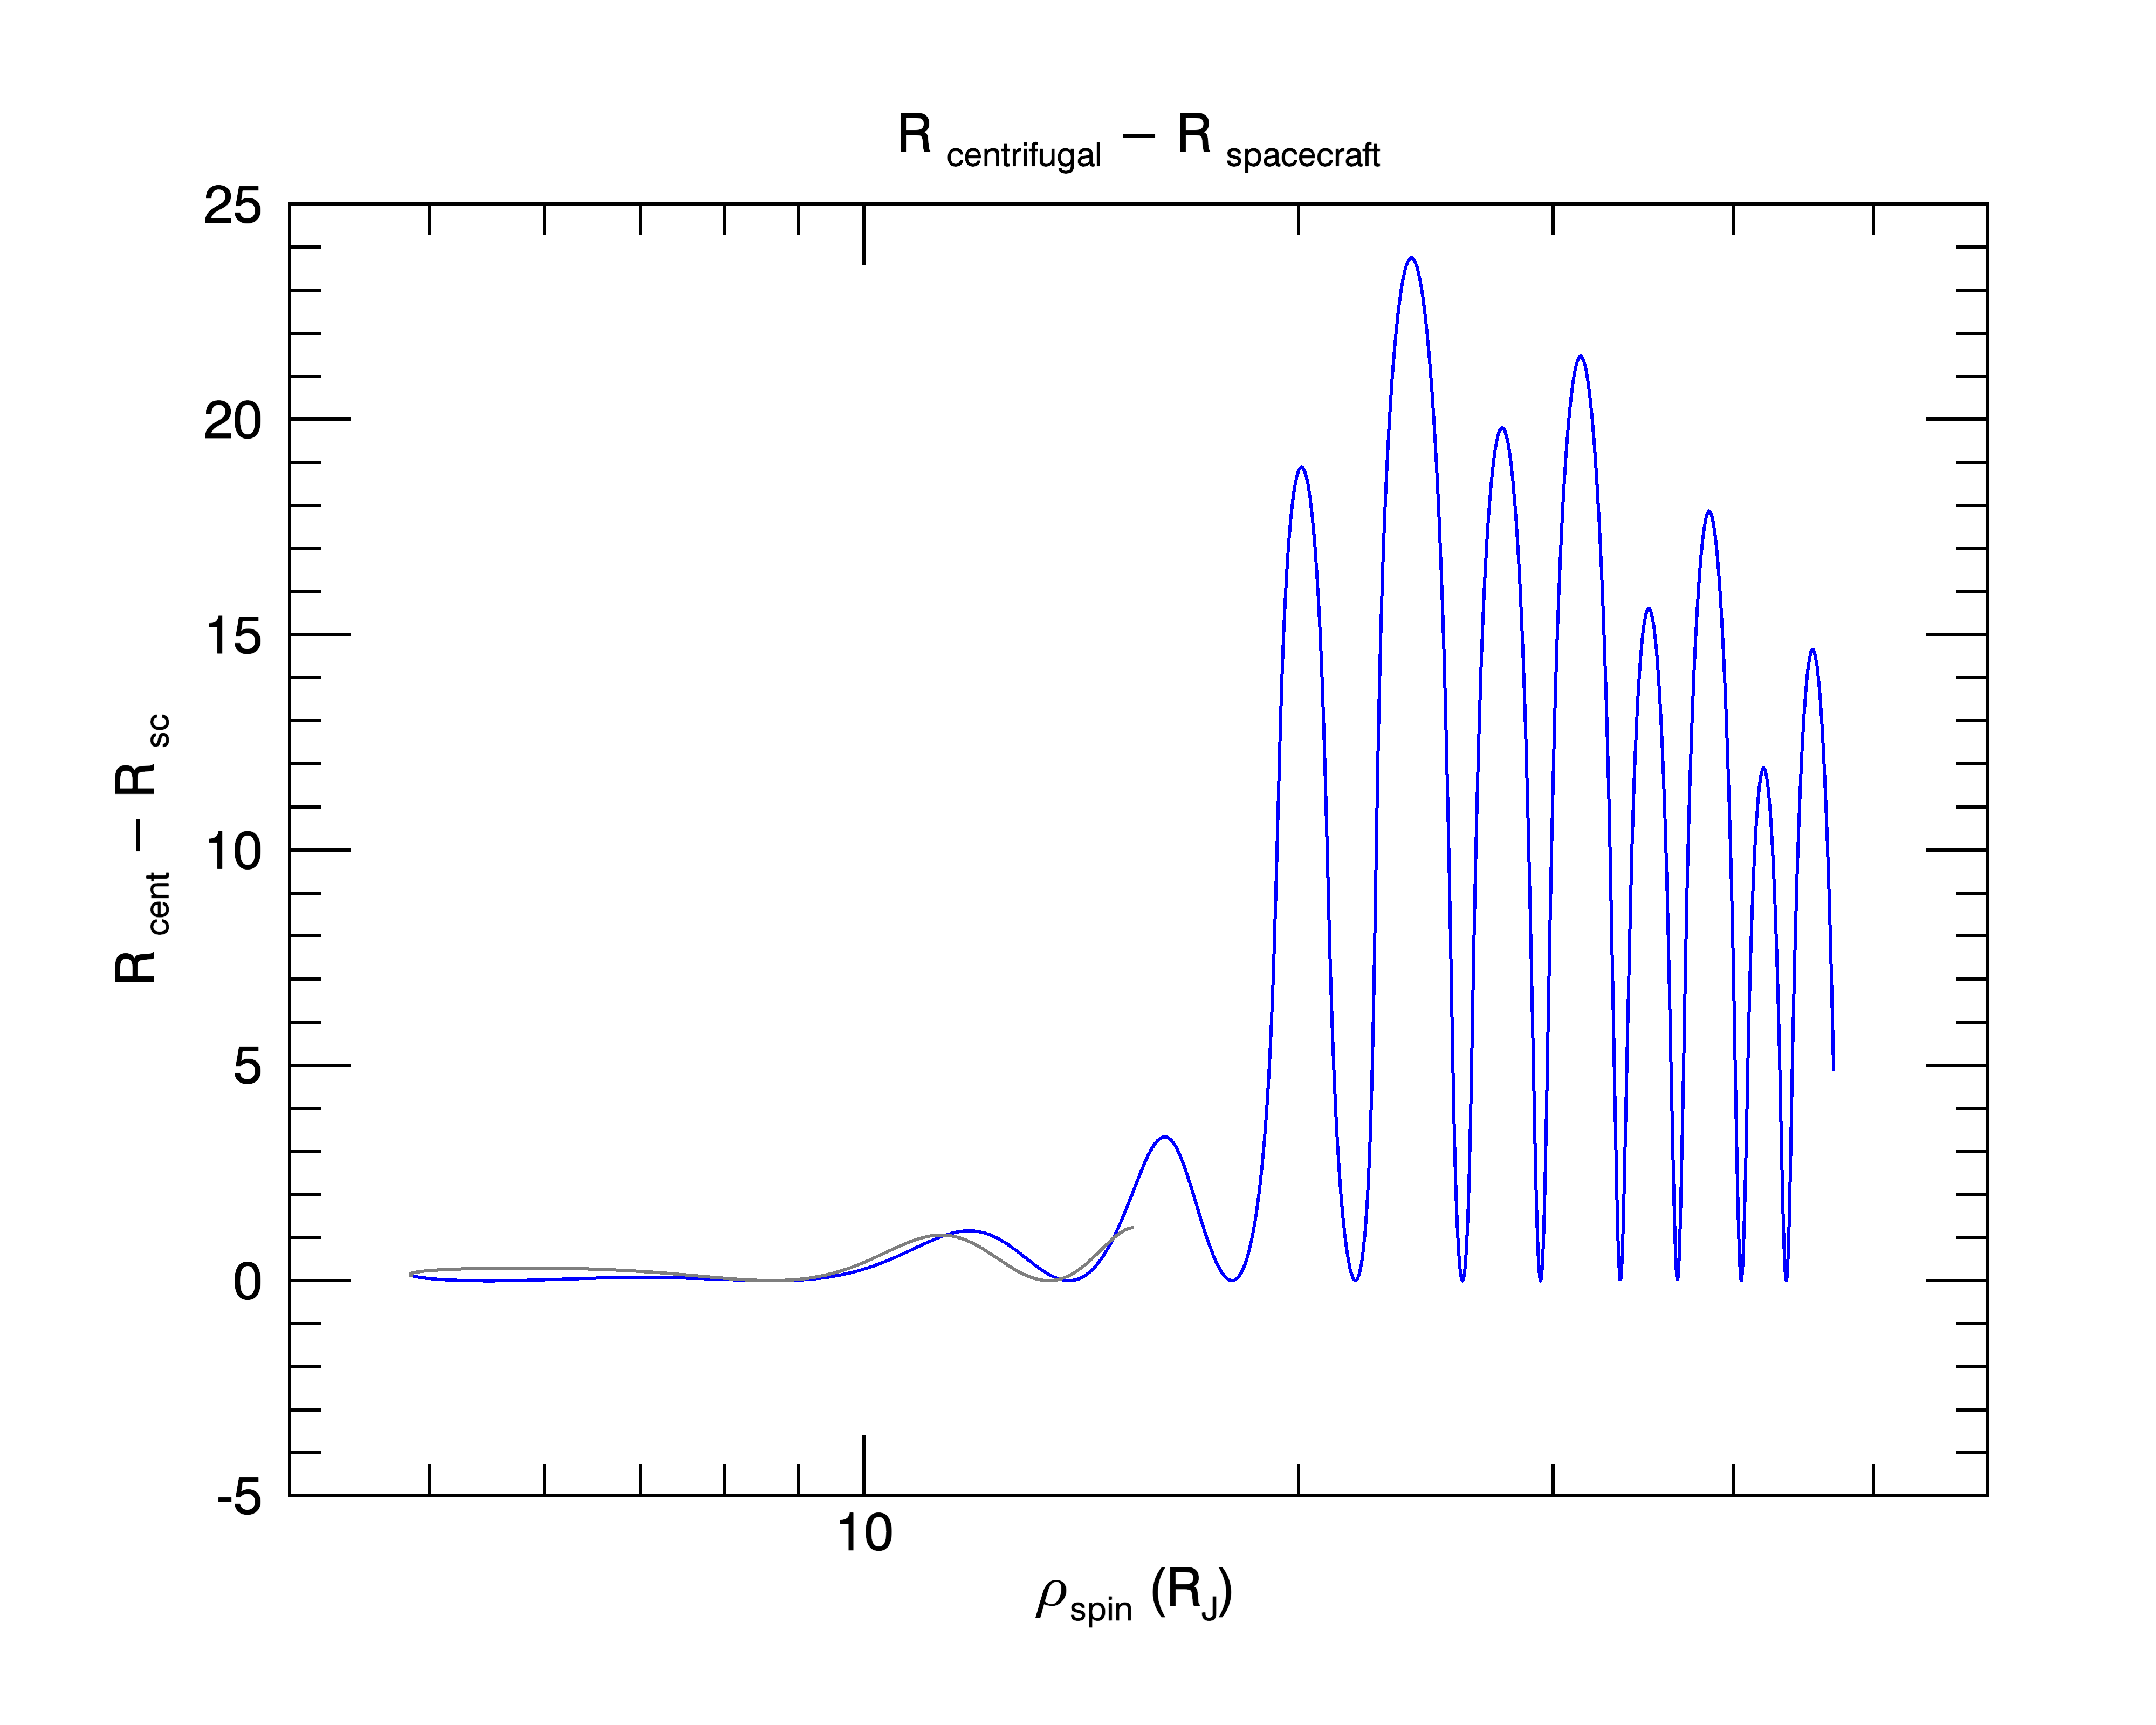 |
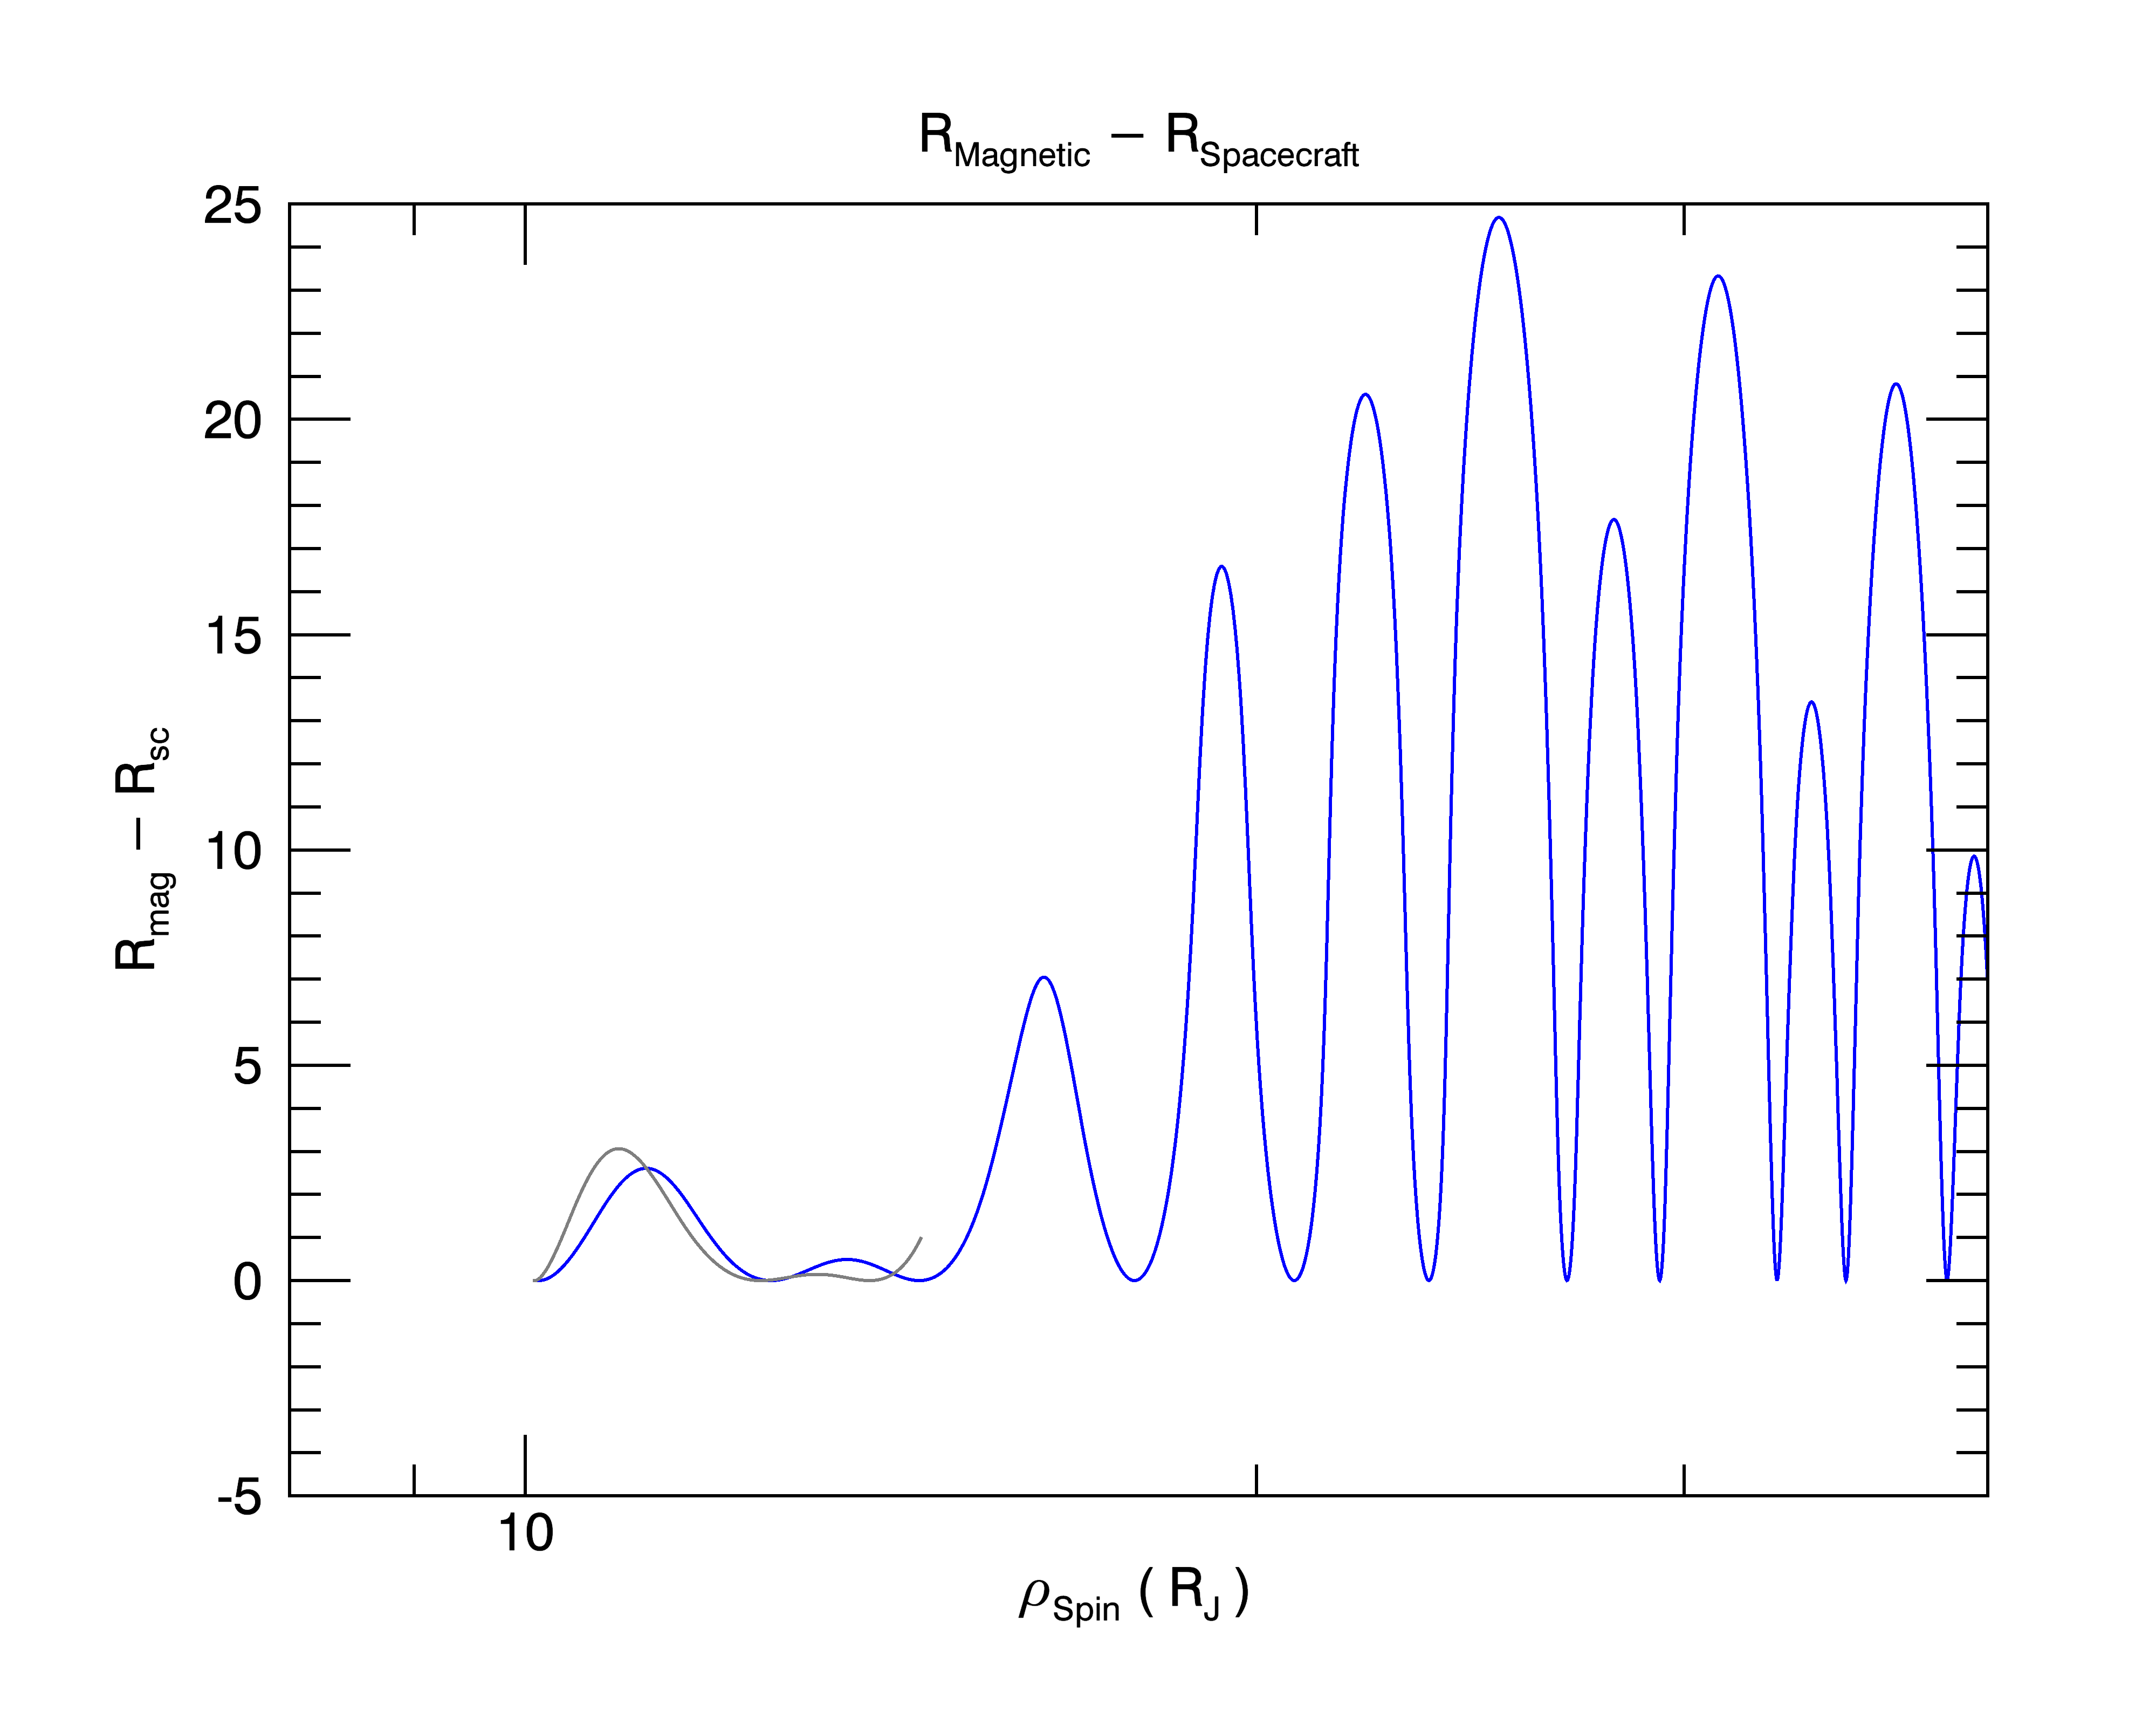
The plot to the left shows the radial separation between the location of the centrifugal equator and the Voyager 1 spacecraft as it traverses the magnetic field structure of Jupiter. Where the curve is blue, the spacecraft is traveling inbound while the grey portion of the curve represents outbound data. (Click image for full size) |
 |
The plot to the left shows the radial separation between the location of the centrifugal equator and the Voyager 2 spacecraft as it traverses the magnetic field structure of Jupiter. Where the curve is blue, the spacecraft is traveling inbound while the grey portion of the curve represents outbound data. (Click image for full size) |
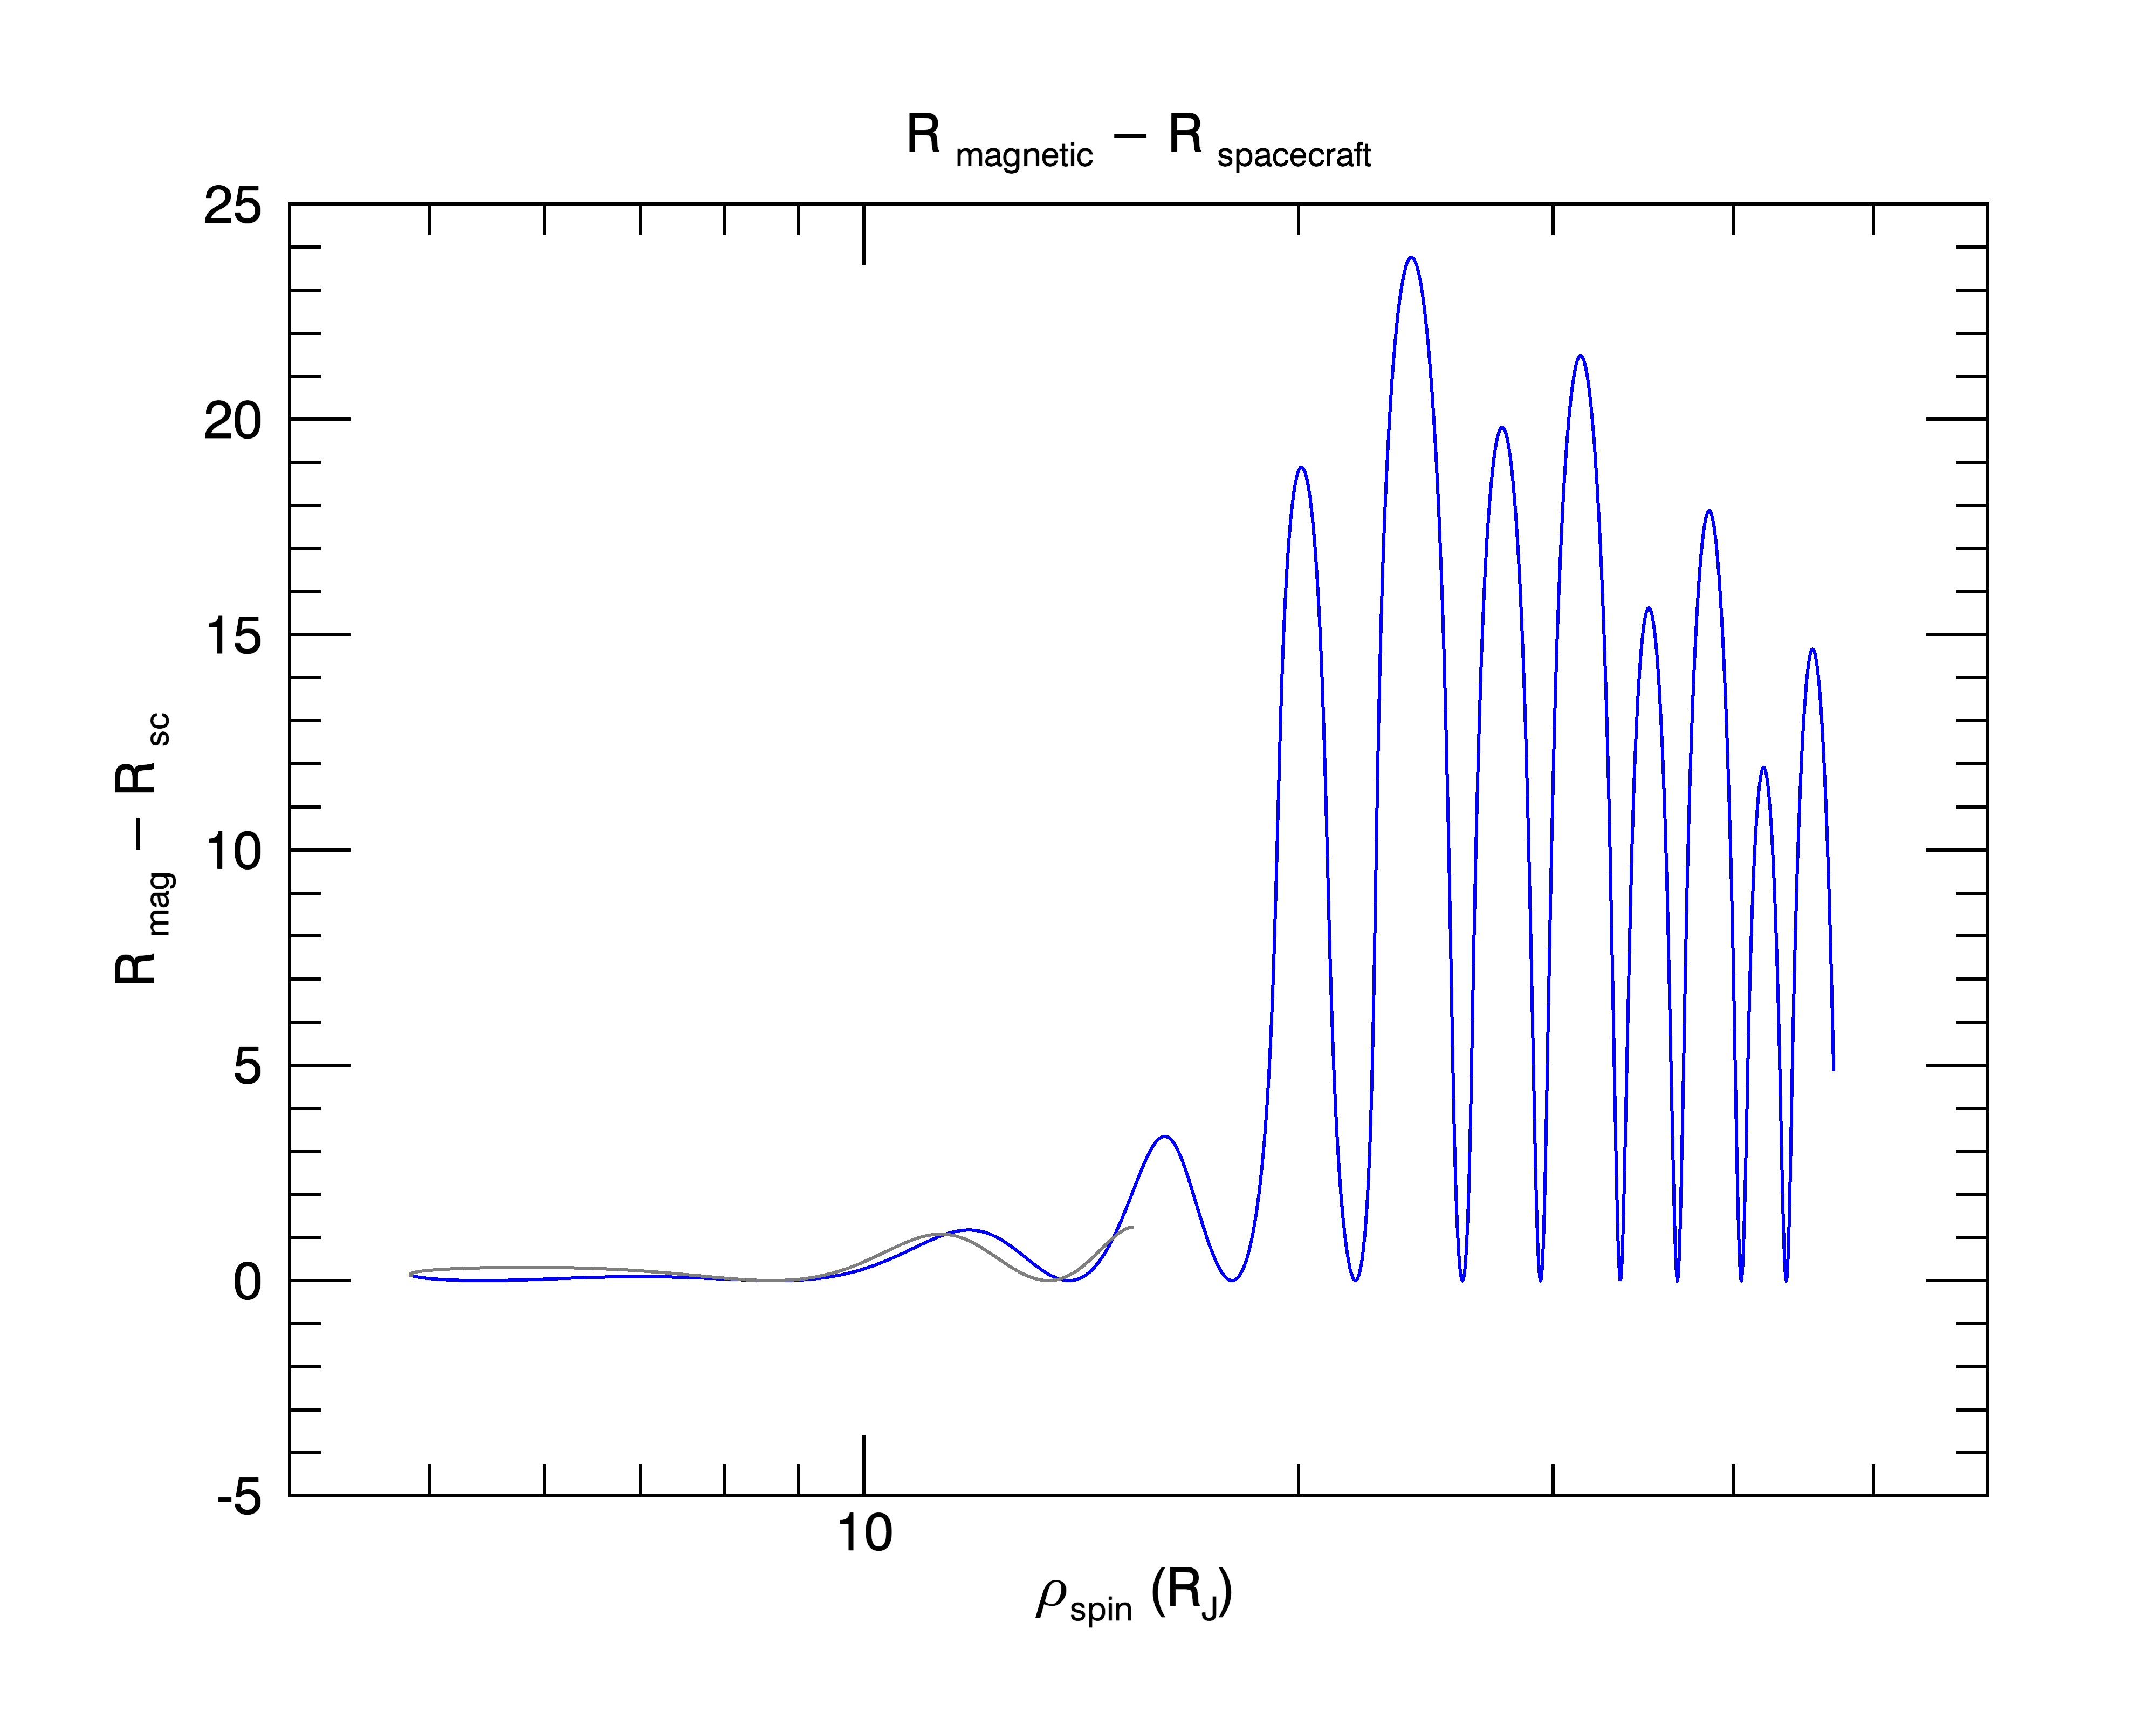 |
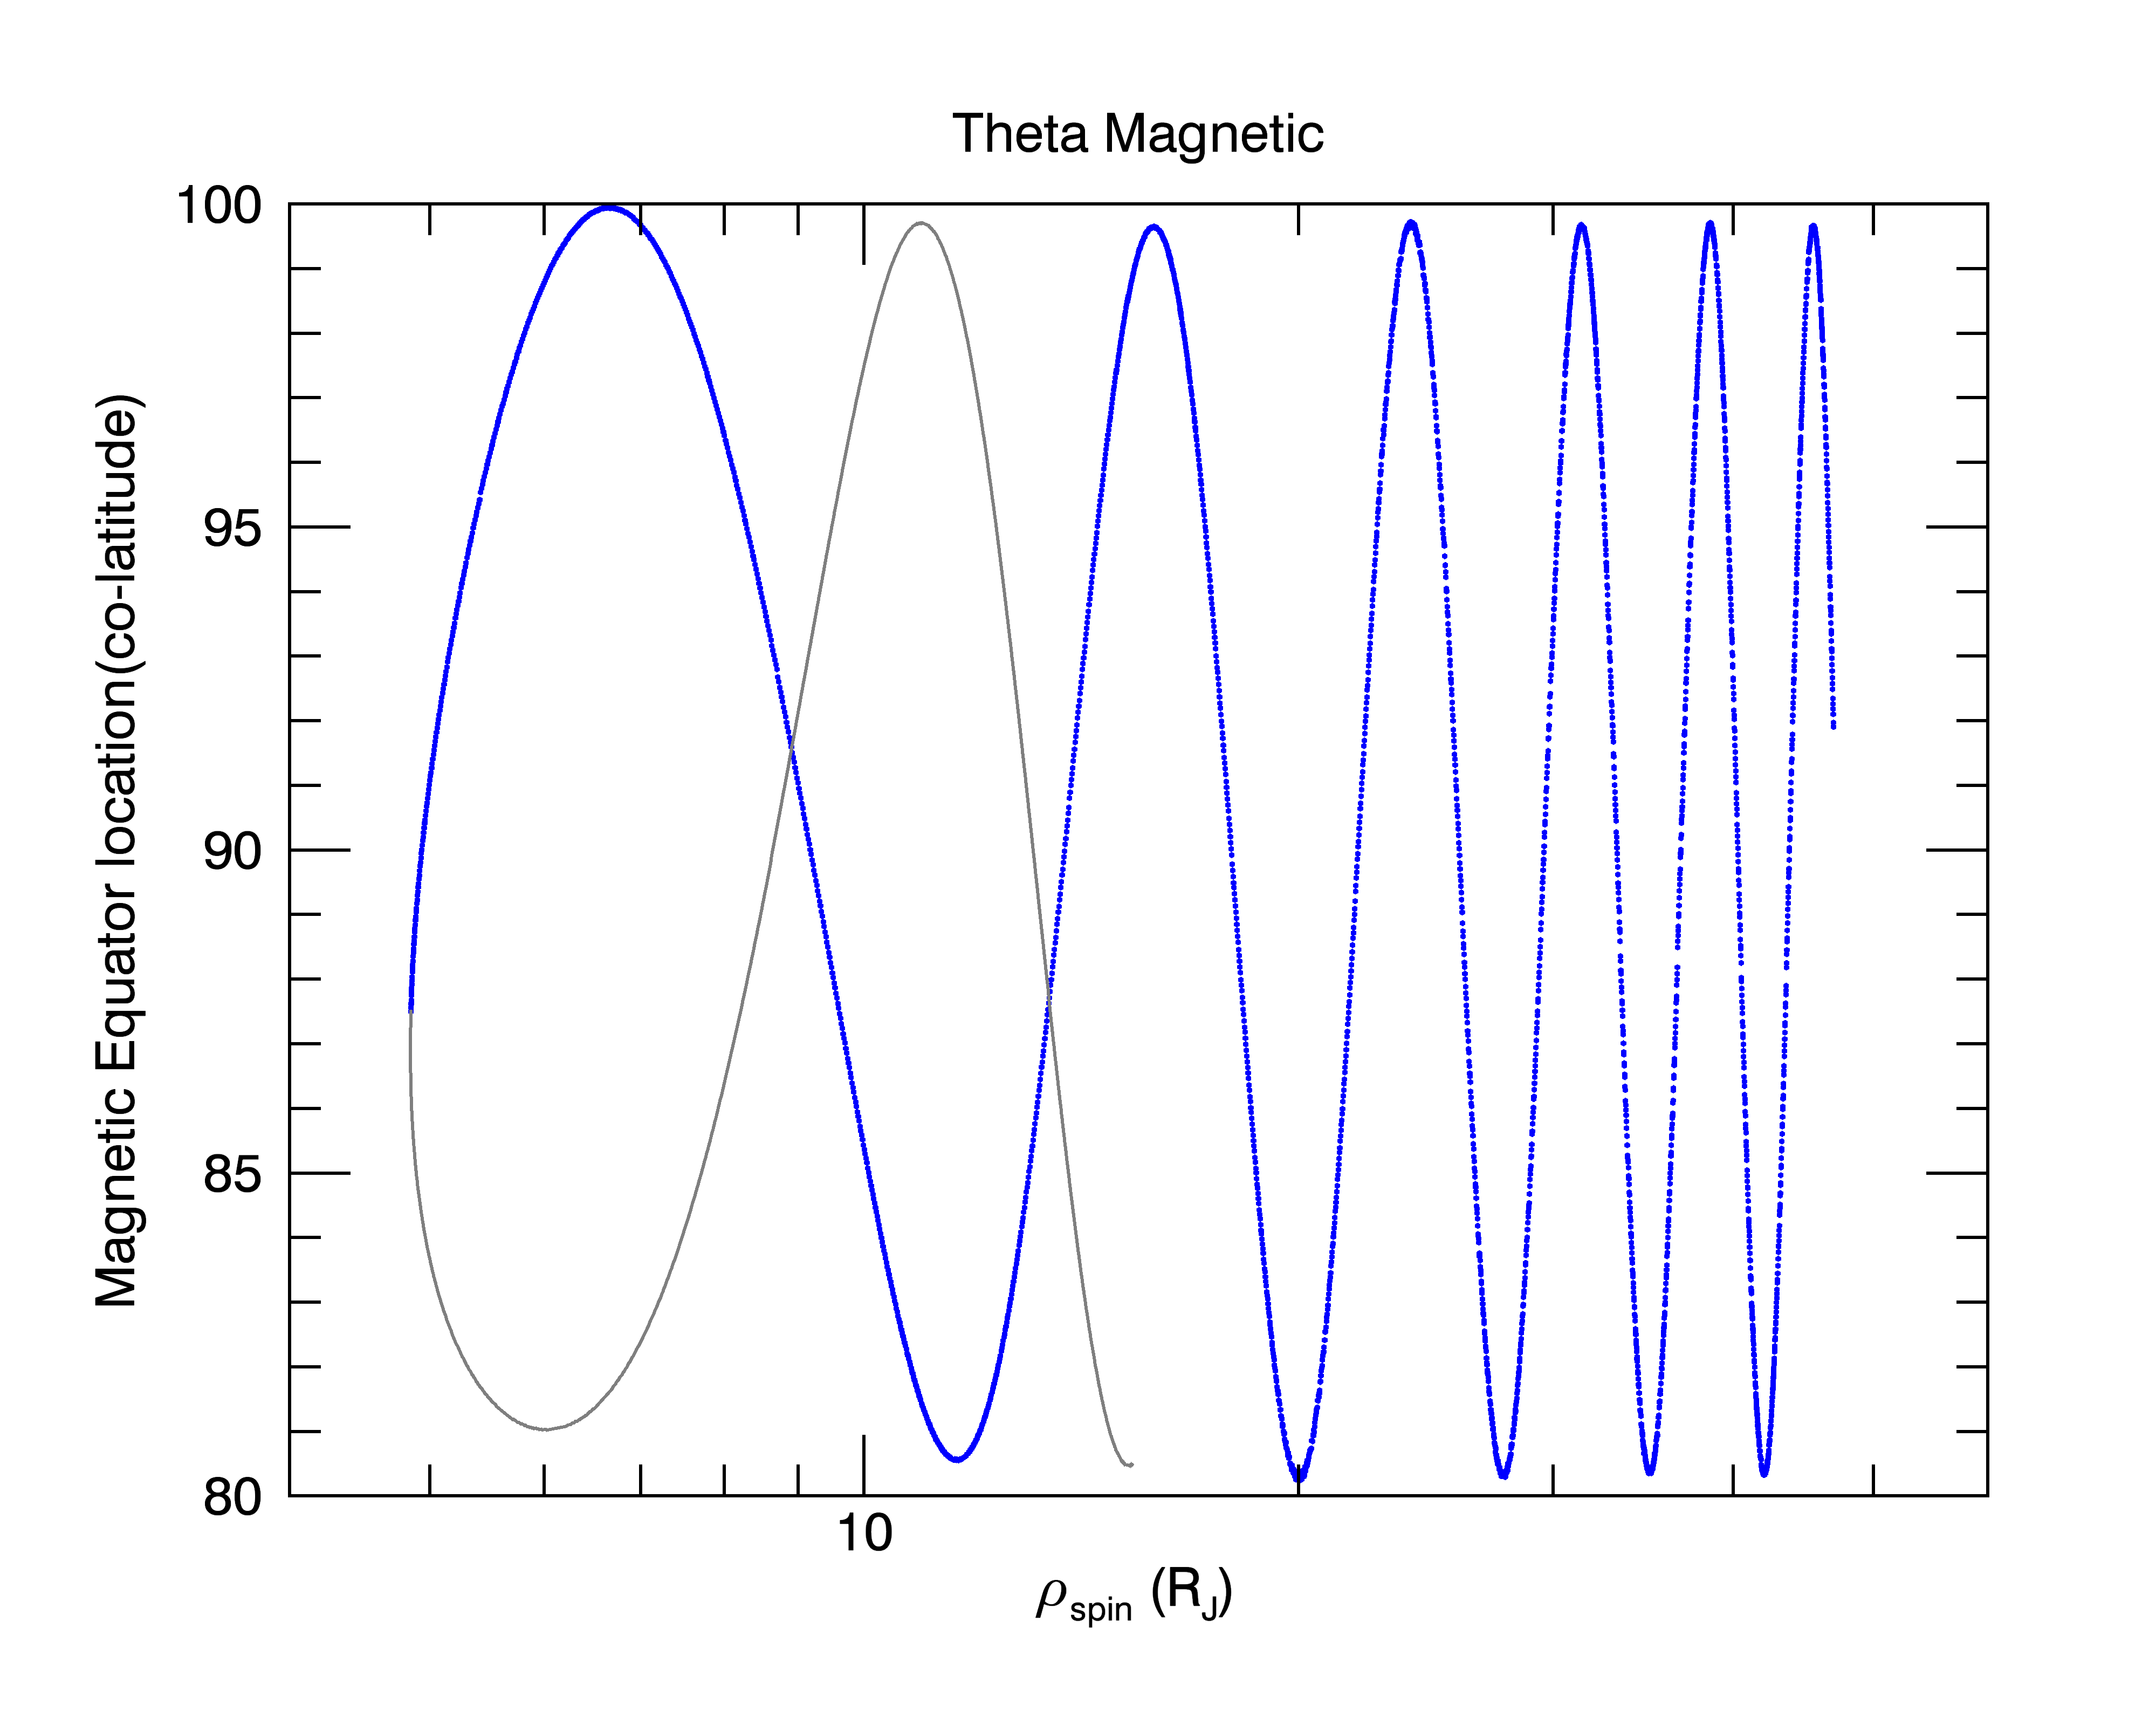
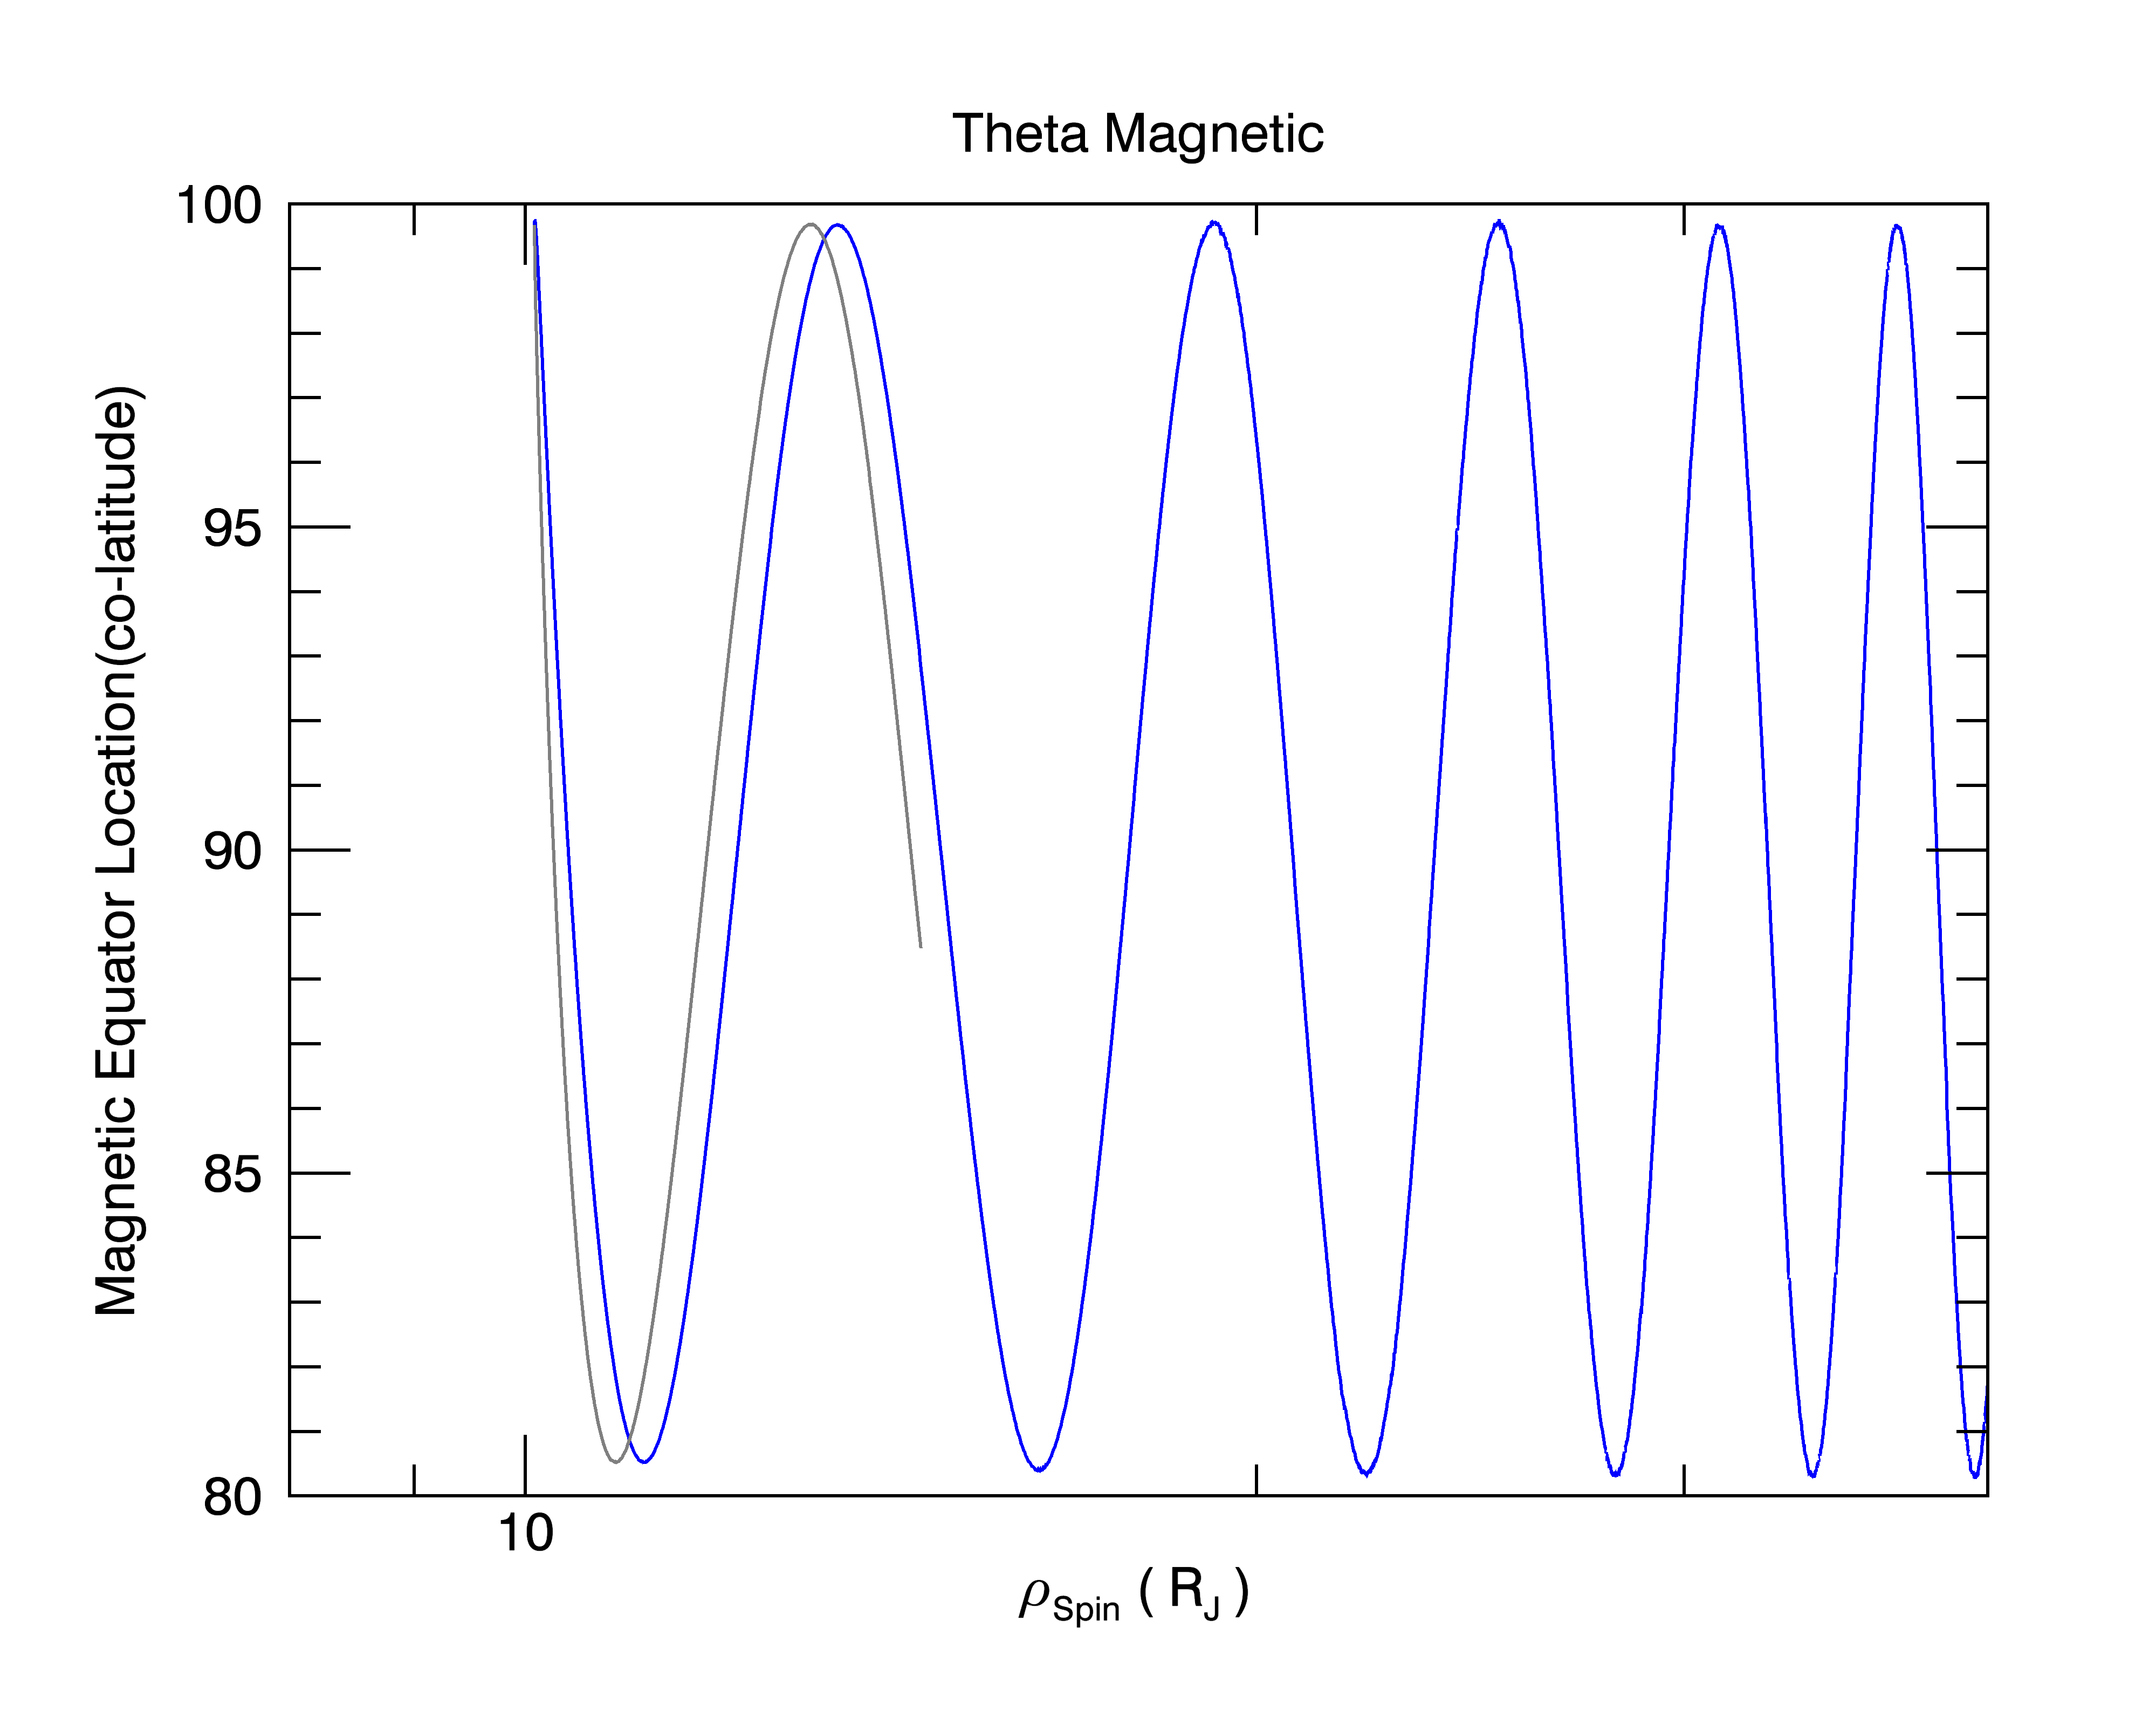
The plot to the left shows the radial separation between the location of the magnetic equator and the Voyager 1 spacecraft as it traverses the magnetic field structure of Jupiter. Where the curve is blue, the spacecraft is traveling inbound while the grey portion of the curve represents outbound data. (Click image for full size) |
 |
The plot to the left shows the radial separation between the location of the magnetic equator and the Voyager 2 spacecraft as it traverses the magnetic field structure of Jupiter. Where the curve is blue, the spacecraft is traveling inbound while the grey portion of the curve represents outbound data. (Click image for full size) |
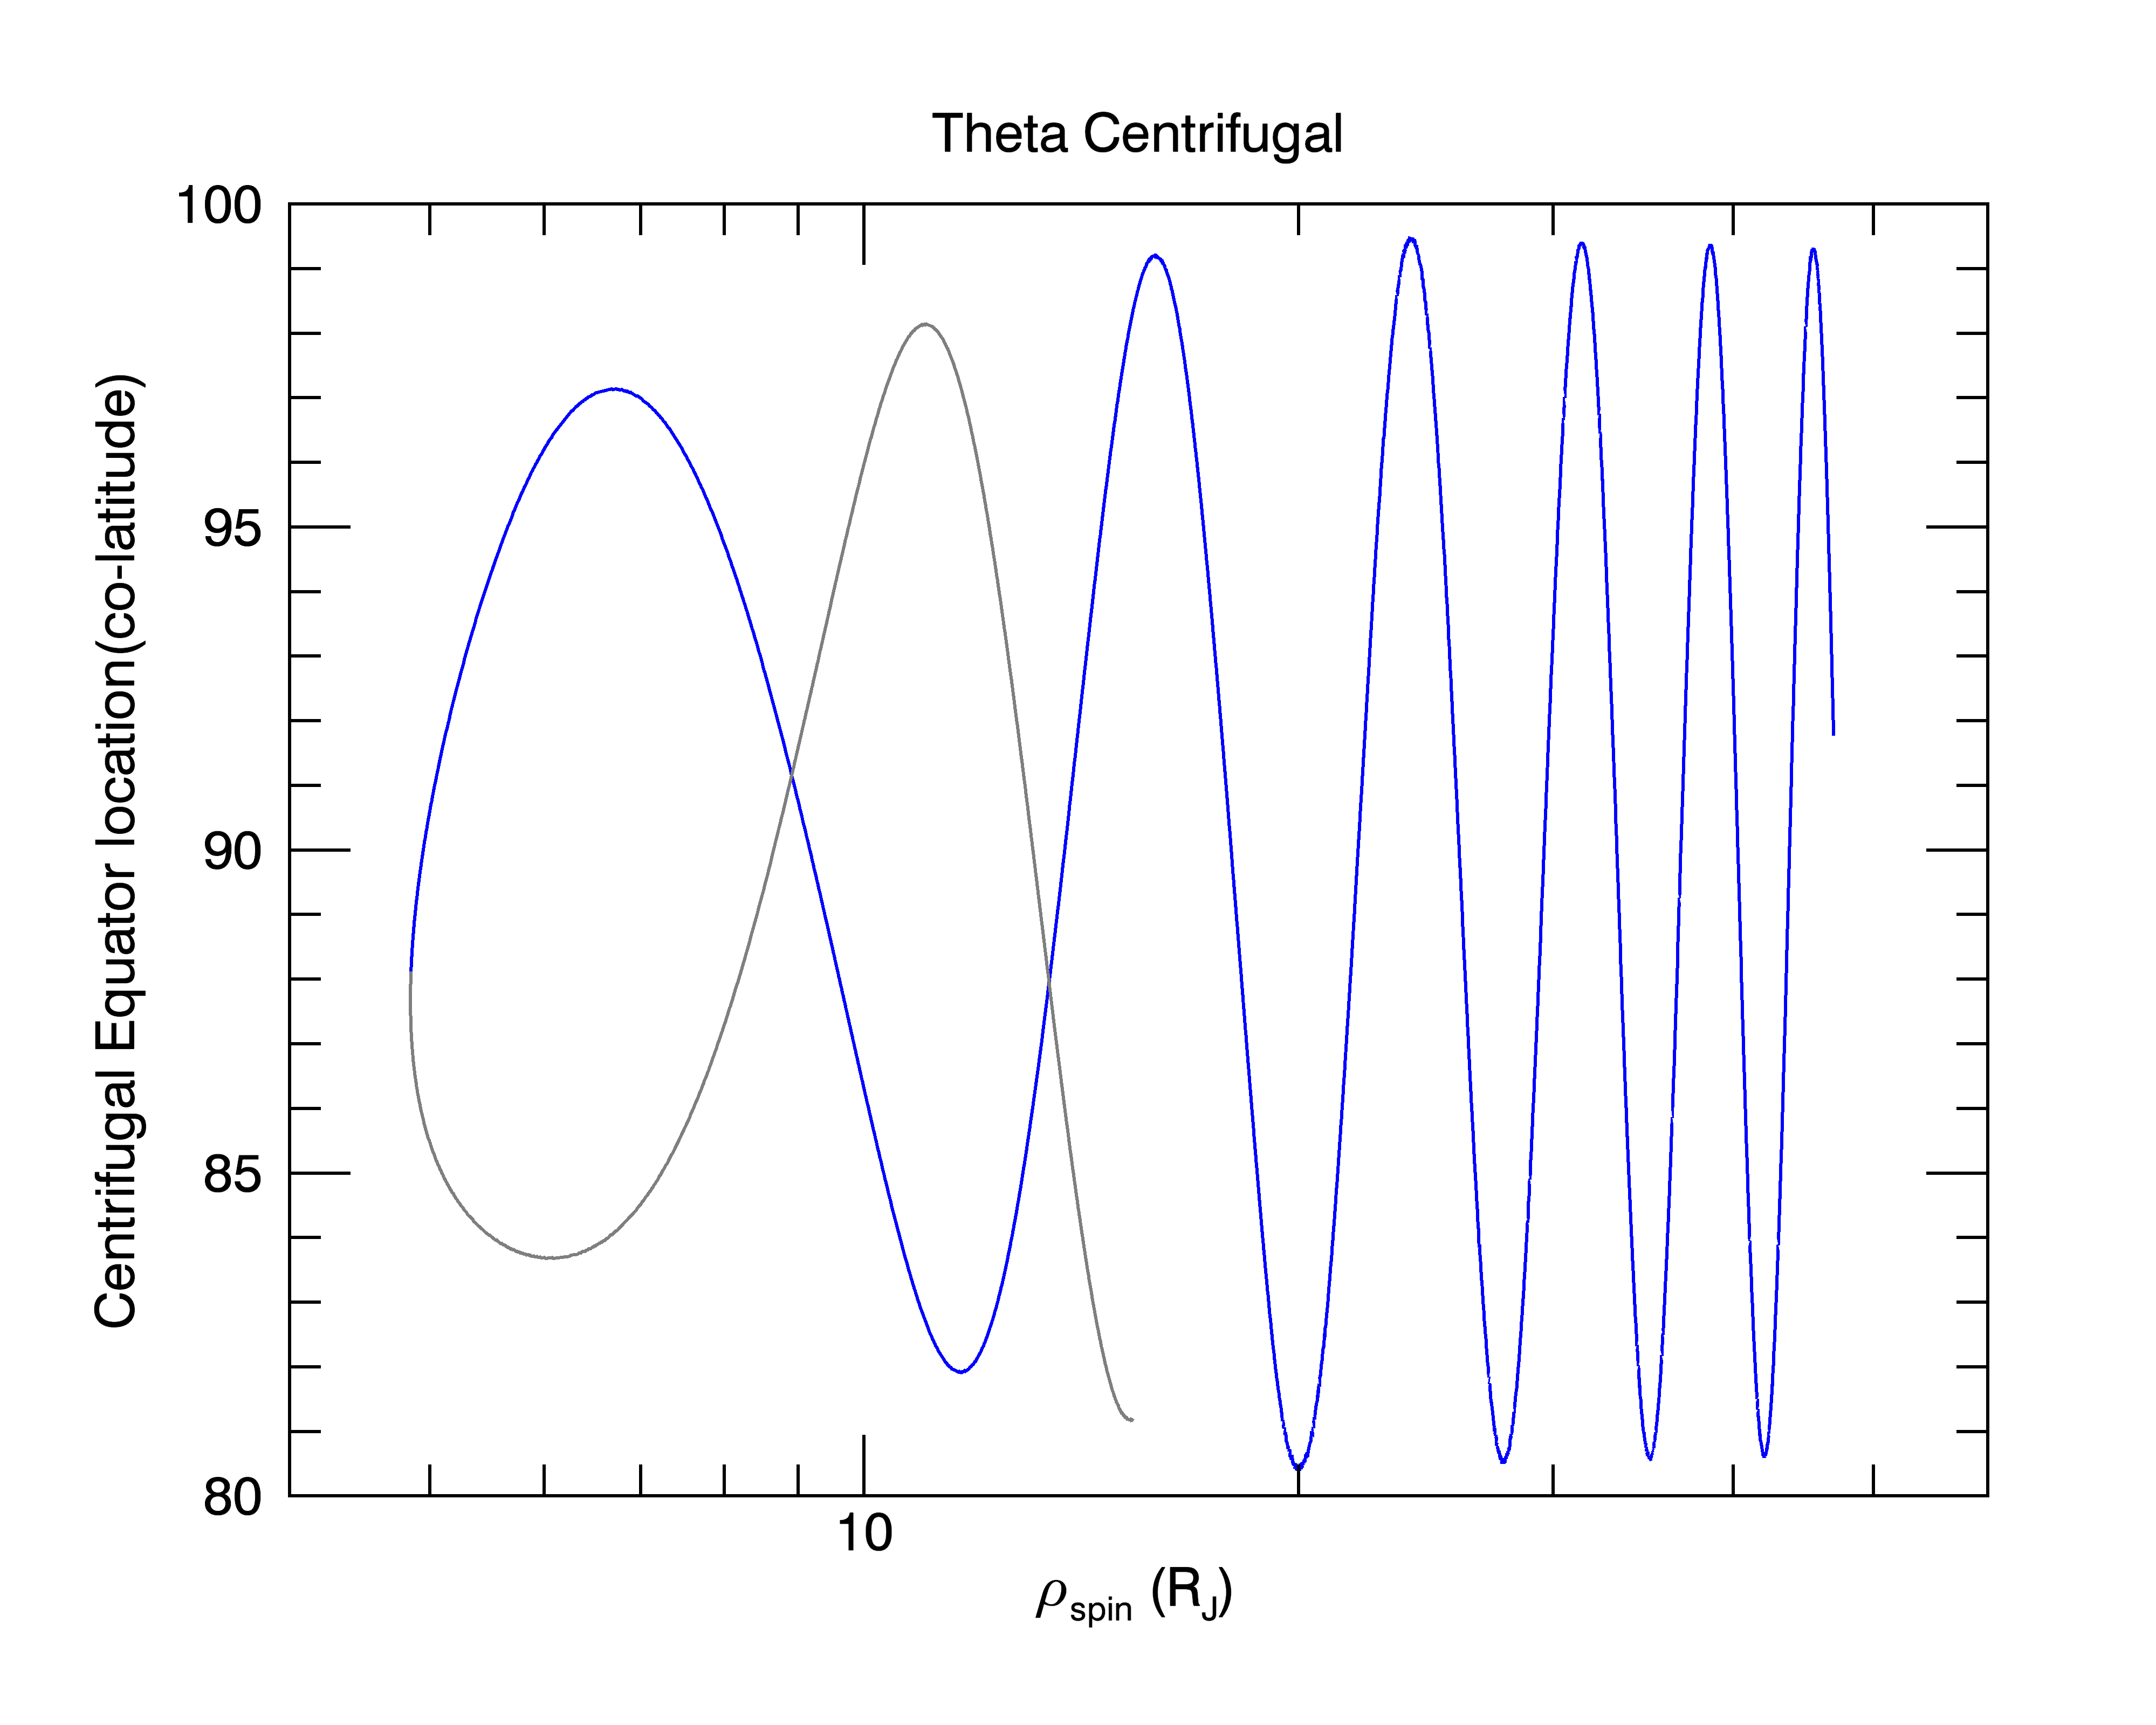 |
The plot to the left shows the latitude of the centrifugal equator relative to the spin aligned coordinate reference frame as the Voyager 1 spacecraft flew past Jupiter with blue representing the inbound trajectory and grey representing outbound. (Click image for full size) |
 |
The plot to the left shows the latitude of the centrifugal equator relative to the spin aligned coordinate reference frame as the Voyager 2 spacecraft flew past Jupiter with blue representing the inbound trajectory and grey representing outbound. (Click image for full size) |
 |
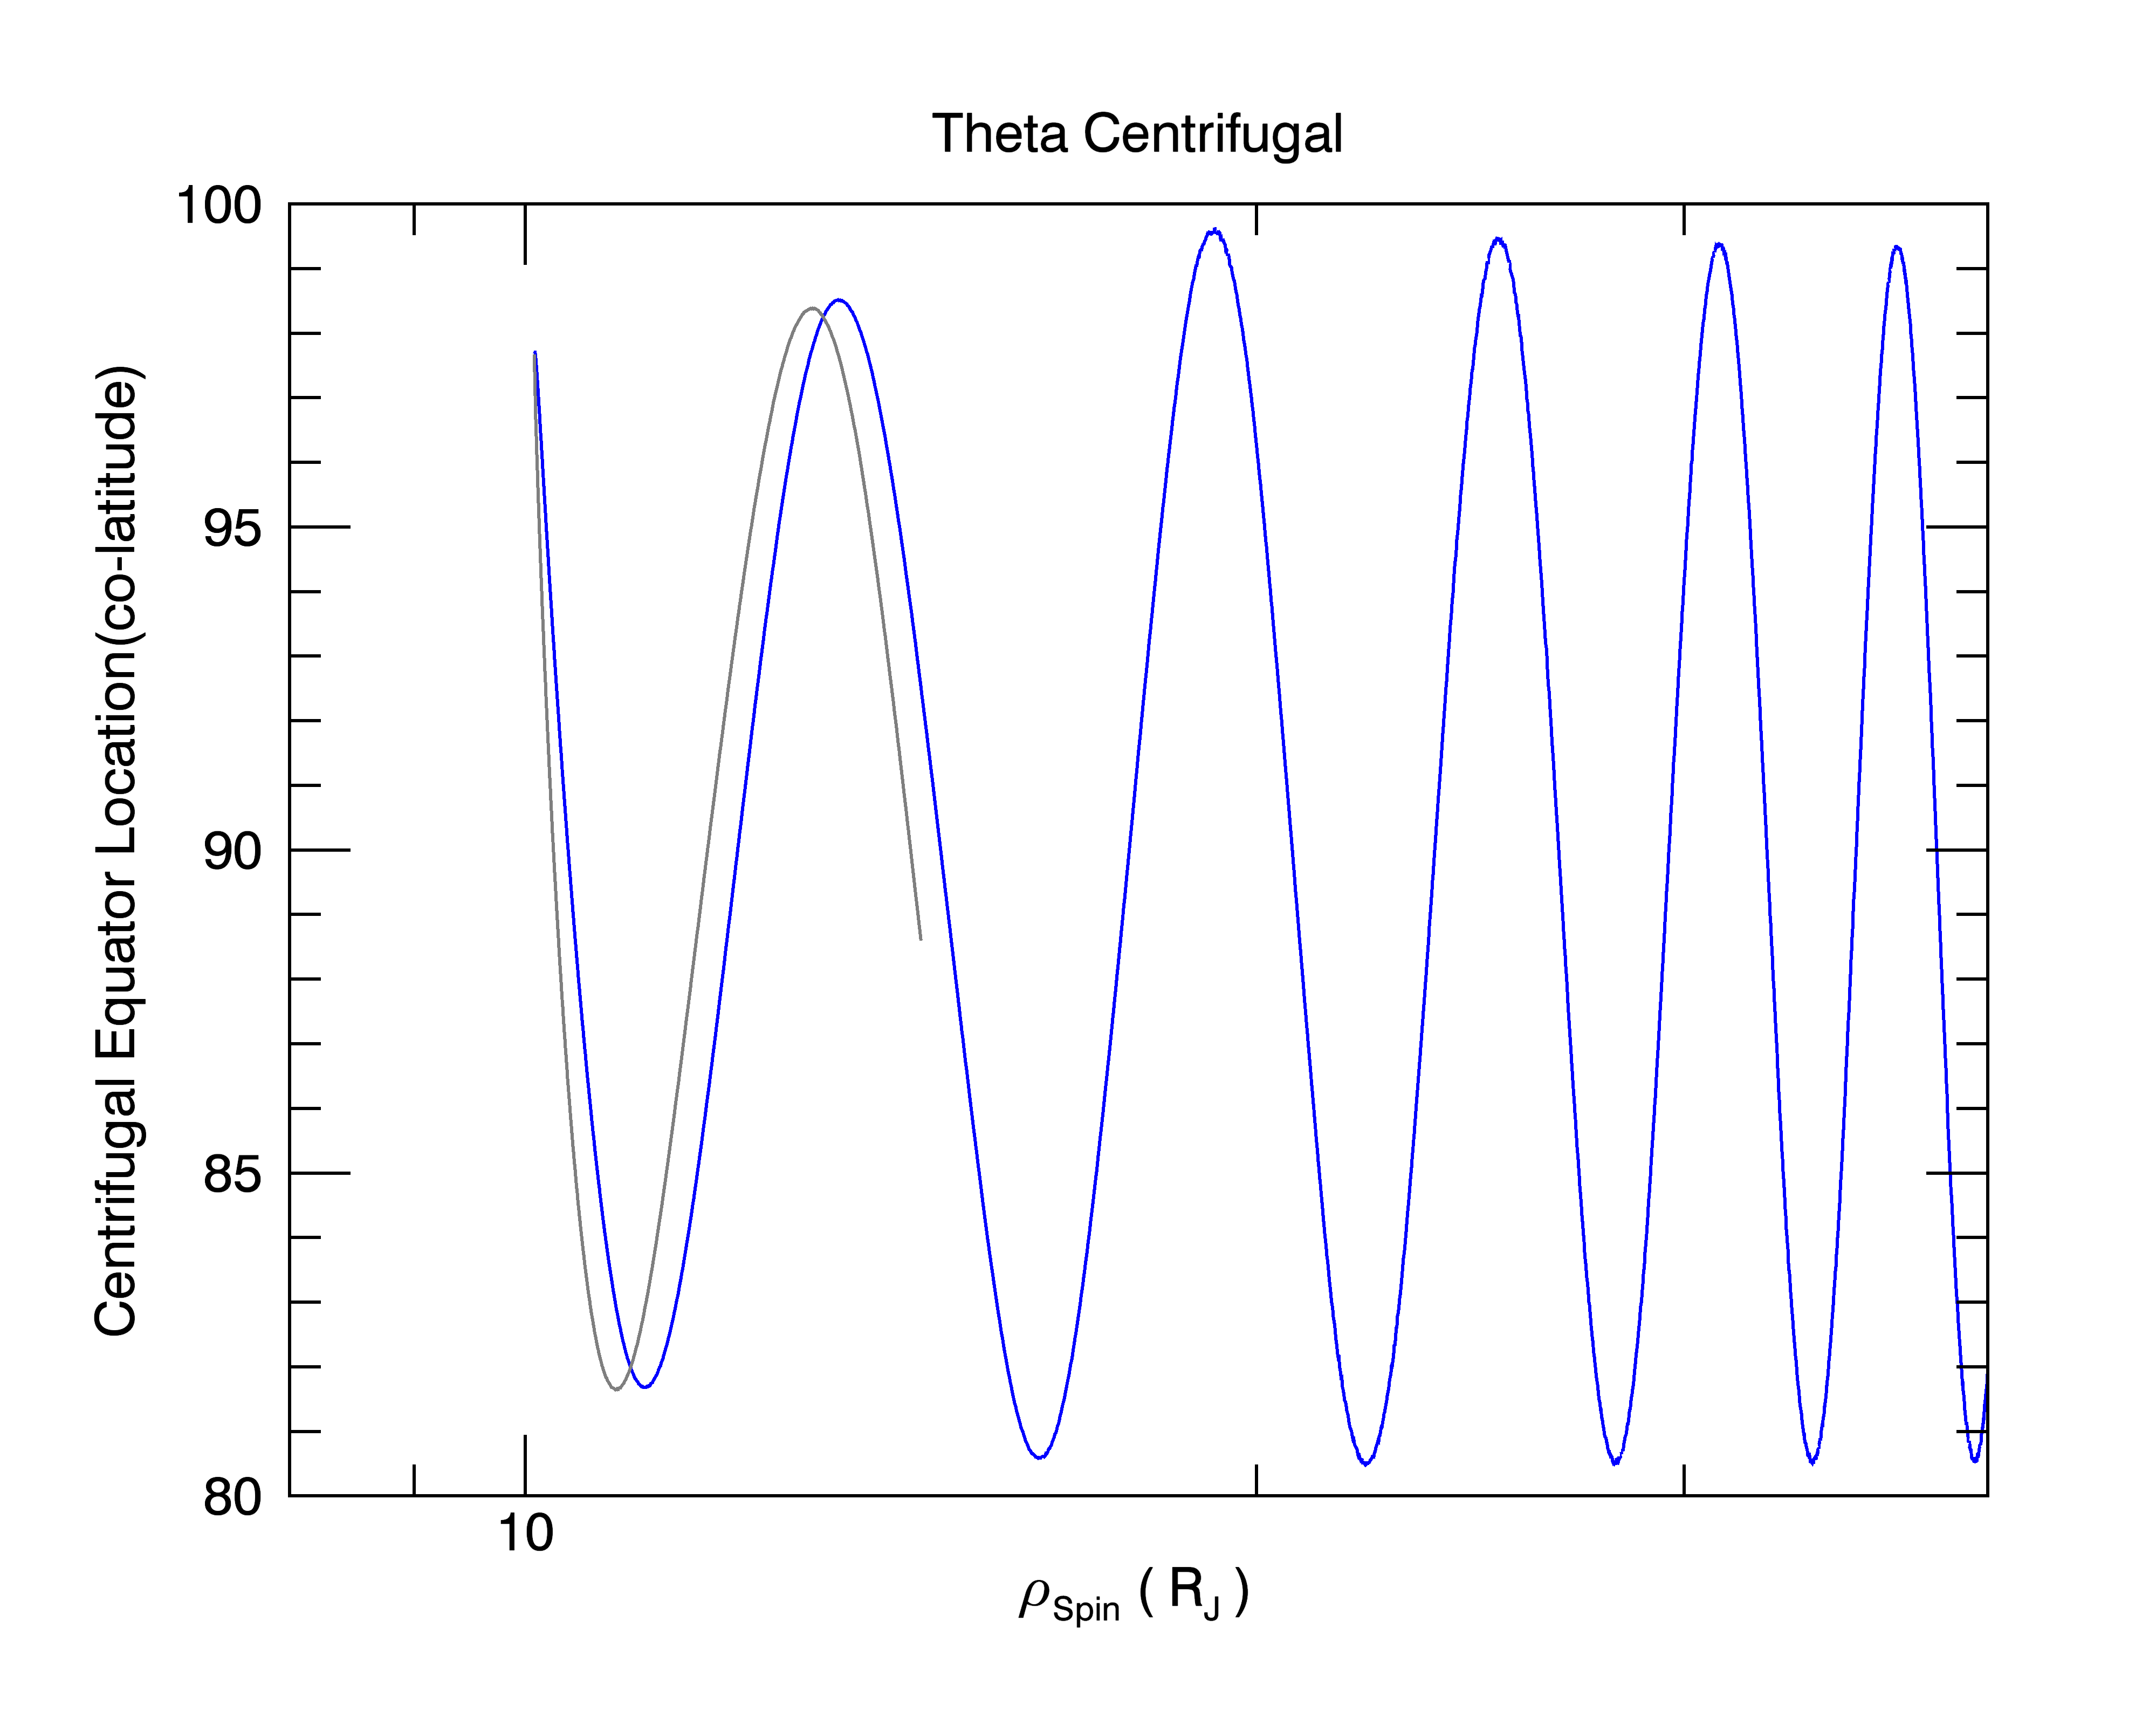
The plot to the left shows the latitude of the centrifugal equator relative to the spin aligned coordinate reference frame as the Voyager 1 spacecraft flew past Jupiter with blue representing the inbound trajectory and grey representing outbound. (Click image for full size) |
 |
The plot to the left shows the latitude of the centrifugal equator relative to the spin aligned coordinate reference frame as the Voyager 2 spacecraft flew past Jupiter with blue representing the inbound trajectory and grey representing outbound. (Click image for full size) |