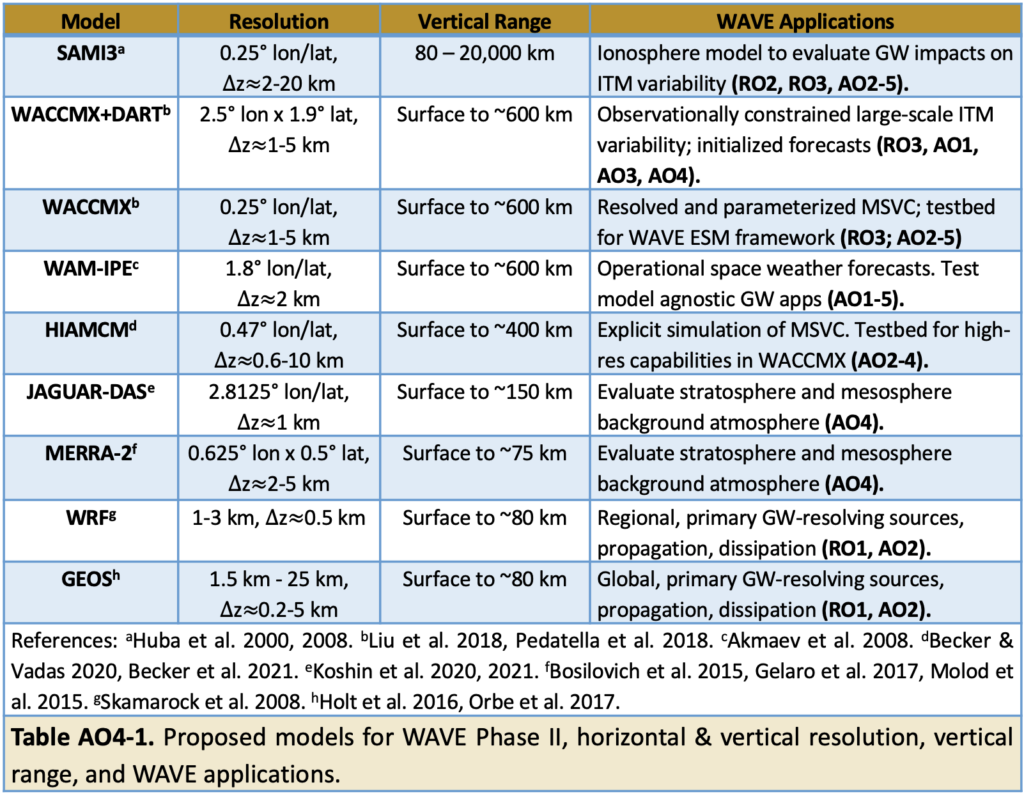
WAVE utilizes a wide variety of models to study atmosphere-ionosphere coupling mechanisms related to wave propagation from the lower atmosphere.
Proposed Models for WAVE Phase II
Weather Research and Forecasting (WRF) Model

Figure Caption: Gravity waves simulated in WRF in the upper stratosphere above North Australia. These waves were generated by deep convection in the area surrounding Darwin Australia.
Model Description: The Weather Research and Forecasting (WRF) Model is a next-generation mesoscale numerical weather prediction system designed for both atmospheric research and operational forecasting applications. This model was developed in a collaborative partnership of the National Center for Atmospheric Research (NCAR), the National Oceanic and Atmospheric Administration (represented by the National Centers for Environmental Prediction (NCEP) and the Earth System Research Laboratory), the U.S. Air Force, the Naval Research Laboratory, the University of Oklahoma, and the Federal Aviation Administration (FAA). WRF can be used in two configurations: either in the “real”, full-physics configuration or in the “idealized”, dry configuration. An important aspect is its ability to simulate the atmosphere from the ground up to 80 km at high horizontal resolutions (e.g. 1km). In WAVE we will take advantage of an idealized WRF setup developed at NWRA that inputs latent heating derived from observations and simulates a large portion of the convective gravity wave spectrum up to the mesosphere.
See: https://www.mmm.ucar.edu/weather-research-and-forecasting-model
References: Skamarock, W. C., Klemp, J. B., Dudhia, J., Gill, D. O., Barker, D. M., Duda, M. G., et al. (2008). A description of the advanced research WRF version 3 (NCAR Tech. Note NCAR/TN‐475+STR, 113 pp). https://doi.org/10.5065/D68S4MVH
High Altitude Mechanistic General Circulation Model (HIAMCM)

Figure Caption: Snapshot of gravity waves (relative temperature perturbations, colors) and the large-scale horizontal wind (arrows, scale in the lower left corner) in the thermosphere on 11 January 2016 (1:30 UT) as simulated with the HIAMCM nudged to MERRA-2 reanalysis. A large concentric ring structure is centered over Europe. These are tertiary gravity waves that propagate roughly against the large-scale wind and have horizontal phase speeds of several 100 m/s.
Model Description: The High Altitude Mechanistic general Circulation Model (HIAMCM) extends from the surface to an altitude of about 450 km. The model is based on a standard spectral dynamical core and has a high spatial resolution (equivalent horizontal grid spacing of 52 km; vertical level spacing of 600 below ~130 km, larger at higher altitudes). This resolution is combined with an advanced parameterization of macro-turbulent horizontal and vertical diffusion, including molecular viscosity in the thermosphere. As a result, gravity waves (GWs) are simulated explicitly over the whole altitude range. Due to the explicit simulation of the generation, propagation, and dissipation of GWs, the HIAMCM captures the multi-step vertical coupling associated with secondary and tertiary GWs. This coupling mechanism is essential for GW dynamics in the thermosphere, which is a major aspect of the WAVE DRIVE Science Center.
Sami3 is Also a Model of the Ionosphere (SAMI3)
Movie Caption: This movie shows the SAMI3 delta total electron content (TEC) and the propagation of traveling ionospheric disturbances over the continental U.S. during a severe weather event in April 2014. (Courtesy of Sarah McDonald, NRL).
Model Description: The Naval Research Laboratory (NRL) SAMI3 (Sami3 is Also a Model of the Ionosphere) is a comprehensive, physics-based, global model of the ionosphere developed at NRL. SAMI3 is based on SAMI2 (Huba et al., 2000), a two-dimensional model of the ionosphere. SAMI3 models the plasma and chemical evolution of seven ion species (H+, He+, N+, O+, N2+, NO+ and O2+) in the altitude range extending from 70 km to ~8 Re (Earth radii) and magnetic latitudes up to ±88°. SAMI3 solves the ion continuity and momentum equations for all seven of the ion species, and solves the complete temperature equations for the electrons and three ion species (H+, He+ and O+). Ion inertia is included in the ion momentum equation for motion along the geomagnetic field. SAMI3 uses a fixed, non-uniform grid defined in the magnetic coordinate system. One axis of the grid is aligned with the Earth’s geomagnetic field, allowing the model to distinguish between motion along the magnetic field and perpendicular to the magnetic field. The other two grid axes define magnetic east and the vector perpendicular to the magnetic field lines in the radial direction. SAMI3 can be configured to use a tilted dipole model of Earth’s geomagnetic field or a spherical harmonic representation of Magnetic Apex coordinates (Emmert et al., 2010; Richmond, 1995), which includes the International Geomagnetic Reference Field (IGRF) representation of the geomagnetic field.
The SAMI3 electric fields are solved self-consistently by solving a two-dimensional electrostatic potential equation that is derived from current conservation in magnetic (currently magnetic-dipole) coordinates, and including gravity-driven currents. The perpendicular electric field is used in SAMI3 to calculate the mid- and low-latitude E × B drifts (Huba et al., 2008; 2010). The high-latitude region is electrodynamically coupled to the magnetosphere as a result of the interaction of the magnetized solar wind with Earth’s geomagnetic field. To account for ion motion in the polar region, we have included a high-latitude electric potential from the Weimer-2005 model (Weimer, 2005), which is an empirical model that calculates how the polar electric potential responds to changes in the solar wind and interplanetary magnetic field (IMF). Solar extreme ultraviolet (EUV) irradiances are specified using either the NRL Solar Spectral Irradiance (NRLSSI) model (Lean et al., 2010) or using the EUV flux model for Aeronomic Calculations (EUVAC; Richards et al., 1994). In its standard configuration, SAMI3 uses NRL Mass Spectrometer Incoherent Scatter (NRLMSIS 2.0) climatology (Emmert et al., 2021) to specify thermospheric composition and neutral temperature, and the Horizontal Wind Model (HWM14) (Drob et al., 2015) to specify the zonal and meridional thermospheric winds.
SAMI3 has been used to study the impact of Medium Scale Traveling Ionospheric Disturbances (MSTIDs). The model is driven by specifications of the neutral atmosphere that include forcing from below to quantify the effect of the wave perturbations on the ionosphere. Perturbed thermospheric gravity wave fields are used to drive MSTIDs in the SAMI3 ionosphere model.
References: Drob, D. P., et al. (2015). An update to the Horizontal Wind Model (HWM): The quiet time thermosphere, Earth and Space Science, 2, 301–319, doi:10.1002/2014EA000089.
Emmert, J. T., A. D. Richmond, and D. P. Drob (2010). A computationally compact representation of Magnetic-Apex and Quasi-Dipole coordinates with smooth base vectors, J. Geophys. Res., 115, A08322, doi:10.1029/2010JA015326.
Emmert, J. T., Drob, D. P., Picone, J. M., Siskind, D. E., Jones, M. Jr., Mlynczak, M. G., et al. (2020). NRLMSIS 2.0: A whole‐atmosphere empirical model of temperature and neutral species densities. Earth and Space Science, 7, e2020EA001321. https://doi.org/ 10.1029/2020EA001321.
Huba, J.D., G. Joyce, and J.A. Fedder (2000). Sami2 is Another Model of the Ionosphere (SAMI2): A new low-latitude ionosphere model. J. Geophys. Res., 105, 23,035-23,053.
Huba, J. D., G. Joyce, and J. Krall (2008). Three- dimensional equatorial spread F modeling, Geophys. Res. Lett., 35, L10102, doi:10.1029/2008GL033509.
Huba, J. D., and G. Joyce (2010). Global modeling of equatorial plasma bubbles, Geophys. Res. Lett., 37, L17104, doi:10.1029/2010GL044281.
Lean, J. L., T. N. Woods, F. G. Eparvier, R. R. Meier, D. J. Strickland, J. T. Correira, and J. S. Evans (2010). Solar Extreme Ultraviolet Irradiance: Present, Past and Future, J. Geophys. Res., doi:10.1029/2010JA015901.
Richmond, A. (1995). Ionospheric electrodynamics using magnetic APEX coordinates. J. Geomag. Geoelectr., 47, 191-212.
Solomon, S. C., and L. Qian, 2005. Solar extreme-ultraviolet irradiance for general circulation models, J. Geophys. Res., 110, A10306, doi: 10.1029/2005JA011160
Weimer, D. R. (2005). Improved ionospheric electrodynamic models and application to calculating Joule heating rates, J. Geophys. Res., 110, A05306, doi:10.1029/2004JA010884.
Zawdie, K.A., S.E. McDonald, S. Eckermann, D. Broutman, and F. Sassi, 2018. Simulating MSTIDs Generated from Tropospheric Weather. COSPAR, Pasadena, CA, July 15-21, 2018.
Zawdie, K.A., S.E. McDonald, S. Eckermann, D. Broutman, and F. Sassi, 2018b. The Impact of Gravity Wave Signatures in Thermospheric Winds on the Ionosphere. CEDAR Workshop, Santa Fe, NM, June 25-29, 2018.
Zawdie, K.A., S.E. McDonald, S. Eckermann, D. Broutman, and F. Sassi, 2019. Comparing MSTIDs Generated from Tropospheric Weather to the Hooke Model. URSI NRSM, Boulder, CO, January 9-11, 2019.
Whole Atmosphere Model-Ionosphere Plasmasphere Electrodynamics (WAM-IPE)
Movie Caption: A spectrum of waves from lower atmosphere drives wind, temperature, and composition variability in the thermosphere and ionosphere. Waves originating in the lower atmosphere affect the background atmosphere on which solar storm-driven variability is superimposed. WAVE research will determine if and when lower atmosphere waves trigger ionospheric irregularities.
Model Description: The Whole Atmosphere Model (WAM) is an extension of the National Weather Service (NWS) operational Global Forecast System (GFS) model for medium-range weather forecasts. The model extends from the ground to the top of the thermosphere (~600 km depending on solar activity) (Akmaev and Huang, 2008; Akmaev et al., 2008). WAM calculates fields of winds, temperature, and molecular and atomic atmospheric composition. Additional upper atmospheric physics and chemistry, including electrodynamics and ion-neutral interactions, are included. WAM has a spectral hydrostatic dynamical core.
The Ionosphere-Plasmasphere-Electrodynamics (IPE) model (Maruyama et al., 2016) provides the plasma (ionized gas) component of the Earth’s upper atmosphere. IPE is a time-dependent, global three-dimensional model of the ionosphere and plasmasphere from 90 km to approximately 10,000 km. It provides global electron and ion densities, electron and ion temperatures, and plasma flow. The parallel plasma transport is based on the Field Line Interhemispheric Plasma (FLIP) model (Richards et al., 2010). International Geomagnetic Reference Field (IGRF) has been used to determine the model grid. The current version of the IPE simulations uses ~3.5 million grid points, a total of 13,600 flux tubes spaced to yield spatial resolution of 0.34° in latitude and 4.5° in longitude.
WAM has been coupled to IPE to enable the plasma to respond to changes driven by the neutral atmosphere and further study the connection between terrestrial and space weather. The coupling is based on time-dependent 3D re-gridding in the Earth System Modeling Framework in the NOAA Environment Modeling System architecture (Theurich, 2016). The WAM-IPE model ingests solar wind and geomagnetic inputs, provided both by direct observation and as forecasts from NOAA Space Weather Prediction Center (SWPC) from operational runs. The WAM-IPE Forecast System provides products out to two days using these drivers as initialized by the data assimilation (DA) system (Wang et al., 2011). Using DA improves the initial conditions by ingesting meteorological data every six hours based on the existing National Weather Service (NWS) forecasts. The coupled WAM-IPE model has been officially transitioned to the NWS National Centers for Environmental Prediction Central Operations in June 2021, providing space weather operational products at NOAA’s SWPC.
During Phase II of the WAVE DRIVE Science Center, we will implement multi-step vertical coupling (derived from the HIAMCM and tested in WACCMX) into WAM-IPE to evaluate the improvement in the space weather operational forecasts associated with gravity wave-induced Ionosphere-Thermosphere-Mesosphere variability.
A spectrum of waves from lower atmosphere drives wind, temperature, and composition variability in the thermosphere and ionosphere. Waves originating in the lower atmosphere affect the background atmosphere on which solar storm-driven variability is superimposed. WAVE research will determine if and when lower atmosphere waves trigger ionospheric irregularities.
See the Operational WAM-IPE page at SWPC: https://www.swpc.noaa.gov/products/wam-ipe
References: Akmaev, R. A., and H.-M. H. Juang (2008), Using enthalpy as a prognostic variable in atmospheric modelling with variable composition, Q. J. R. Meteorol. Soc., 134(637), 2193–2197, doi:10.1002/qj.345.
Akmaev, R. A., T. J. Fuller-Rowell, F. Wu, J. M. Forbes, X. Zhang, A. F. Anghel, M. D. Iredell, S. Moorthi, and H.-M. Juang (2008), Tidal variability in the lower thermosphere: Comparison of Whole Atmosphere Model (WAM) simulations with observations from TIMED, Geophys. Res. Lett., 35, L03810, doi:10.1029/2007GL032584.
Maruyama, N., Y.-Y. Sun, P. G. Richards, J. Middlecoff, T.-W. Fang, T. J. Fuller-Rowell, R. A. Akmaev, J.-Y. Liu, and C. E. Valladares (2016a), A new source of the midlatitude ionospheric peak density structure revealed by a new Ionosphere-Plasmasphere model, Geophys. Res. Lett., 43, 2429–2435, doi:10.1002/2015GL067312.
Richards, P. G., R. R. Meier, and P. J. Wilkinson (2010), On the consistency of satellite measurements of thermospheric composition and solar EUV irradiance with Australian ionosonde electron density data, J. Geophys. Res., 115, A10309, doi:10.1029/2010JA015368
Theurich, G., et al. (2016), The Earth System Prediction Suite: Toward a coordinated U.S. modeling capability, Bull. Amer. Meteorol. Soc., 97(7), 1229–1247, doi:10.1175/BAMS-D-14-00164.1.
Wang, H., Fuller-Rowell, T. J., Akmaev, R. A., Hu, M., Kleist, D. T., & Iredell, M. (2011). First simulations with a whole atmosphere data assimilation and forecast system: The January 2009 major sudden stratospheric warming. Journal of Geophysical Research,116, A12321. https://doi.org/10.1029/2011JA017081.
The Japanese Atmospheric General circulation model for Upper Atmosphere Research-Data Assimilation System (JAGUAR-DAS)
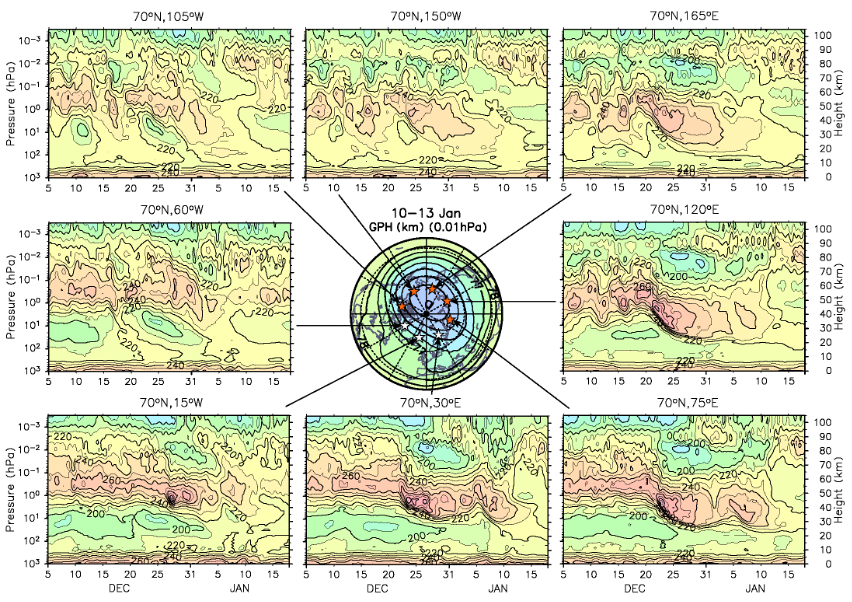
Figure Caption: An orthographic projection of the Northern Hemisphere (center) showing 4-day running mean geopotential height (GPH) at 0.01 hPa for January 10–13, 2019 surrounded by time-height sections of temperature (T) at 70°N latitude and a variety of longitudes (30°E, 75°E, 120°E, 165°E, 150°W, 105°W, 60°W, and 15°W). Star symbols in the GPH map denote the locations for the T figures. Orange stars show locations at which an elevated stratopause appears clearly at a height of ∼80 km (the same as Figure 3 of Okui et al. (2021) but using JAGUAR-DAS outputs). Courtesy of Haruka Okui.
Model Description: JAGUAR-DAS is an assimilation system developed by a joint project by The University of Tokyo and the Japan Agency for Marine-Earth Science and Technology (JAMSTEC) (Koshin et al., 2020; 2021). JAGUAR-DAS employs a four-dimensional local ensemble transform Kalman filter (4D-LETKF) data assimilation system (Miyoshi and Yamane, 2007). The JAGUAR, which was used in JAGUAR-DAS as a forecast model, is a comprehensive numerical model that extends from the Earth’s surface to the lower thermosphere (~150 km) (Watanabe and Miyahara, 2009). It is based on the Model for Interdisciplinary Research on Climate (MIROC) and the Kyushu-GCM and cooperatively developed by JAMSTEC, Kyushu University, and The University of Tokyo. A full set of physical parameterizations necessary for the surface to ~150 km is included.
JAGUAR-DAS assimilates the standard National Centers for Environmental Prediction (NCEP) PREPBUFR dataset for the troposphere and lower stratosphere. For the stratosphere, mesosphere, and lower thermosphere, JAGUAR-DAS assimilates bias-corrected MLS temperature retrievals from 100–0.002 hPa (~16–90 km altitude), SABER temperature retrievals from 40–0.00014 hPa (~22–110 km altitude) and the SSMI/S UAS microwave radiance measurements from 10–0.01hPa (~30–80 km). Model error covariances are estimated from 50-member ensembles. The output from JAGUAR-DAS is 6-hourly and has horizontal grid spacing of 2.8125° in latitude and longitude. JAGUAR-DAS contributed to the intercomparison of middle atmospheric meteorological analyses for the northern hemisphere winter 2009-2010 (McCormack et al., 2021).
JAGUAR-DAS outputs are used as initial values of gravity-wave permitting high-resolution JAGUAR simulations. A series of hindcasts of the major sudden warming occurred in the northern hemisphere winter 2018-2019 were performed using T639 (the minimum resolvable horizontal wavelength of 60 km) using JAGUAR with vertical intervals of 300 m in the middle atmosphere. An elevated stratopause appeared after the sudden warming event ceased. The dynamics of the formation of the elevated stratopause was examined in detail from the viewpoint of the interaction of gravity waves and planetary waves with the mean field (Okui et al., 2021). The three-dimensional structure of the elevated stratopause analyzed using JAGUAR-DAS output is shown here.
References: Koshin, D., Sato, K., Miyazaki, K., & Watanabe, S. (2020). An ensemble Kalman filter data assimilation system for the whole neutral atmosphere. Geoscientific Model Development, 13, 3145–3177. https://doi.org/10.5194/gmd-13-3145-2020
Koshin, D., Sato, K., Kohma, M., & Watanabe, S. (2021). An update on the 4D-LETKF data assimilation system for the whole neutral atmosphere, Geoscientific Model Development Discussion. https://doi.org/10.5194/gmd-2020-381
McCormack, J. P., Harvey, V. L., Pedatella, N., Koshin, D., Sato, K., Coy, L., Watanabe, S., Randall, C. E., Sassi, F., and Holt, L. A. (2021). Intercomparison of Middle Atmospheric Meteorological Analyses for the Northern Hemisphere Winter 2009–2010, Atmos. Chem. Phys., in press. https://doi.org/10.5194/acp-2021-224
Miyoshi, T. and Yamane, S, (2007). Local Ensemble Transform Kalman Filtering with an AGCM at a T159/L48 Resolution, Mon. Weather Rev., 135, 3841–3861, https://doi.org/10.1175/2007MWR1873.1
Okui, H., Sato, K., Koshin, D., & Watanabe, S. (2021). Formation of a mesospheric inversion layer and the subsequent elevated stratopause associated with the major stratospheric sudden warming in 2018/19. Journal of Geophysical Research: Atmospheres, 126, e2021JD034681. https://doi.org/10.1029/2021JD034681
Watanabe, S., & Miyahara, S. (2009). Quantification of the gravity wave forcing of the migrating diurnal tide in a gravity wave-resolving general circulation model. Journal of Geophysical Research, 114, D07110. https://doi.org/10.1029/2008JD011218
Whole Atmosphere Community Climate Model with thermosphere-ionosphere eXtension (WACCM-X)
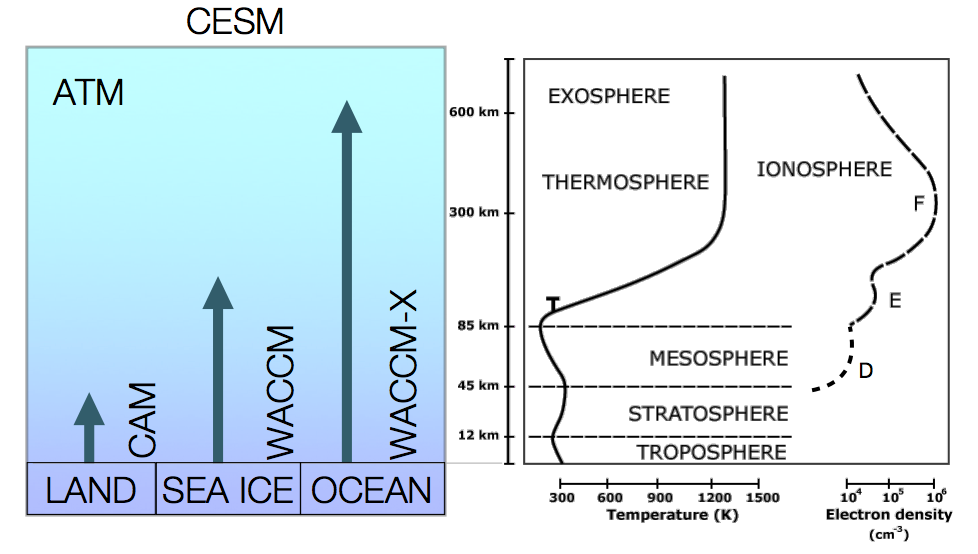
Model Description: The Whole Atmosphere Community Climate Model with thermosphere-ionosphere eXtension(WACCM-X) is a comprehensive numerical model that extends from the Earth’s surface to the upper thermosphere (~500 km). WACCM-X is part of the Community Earth System Model (CESM), an open-source community model. Developed at the National Center for Atmospheric Research (NCAR), CESM models the full Earth system, including the atmosphere, land surface, ocean, and sea ice. WACCM-X includes a comprehensive treatment of the chemical, physical, and dynamical processes necessary to study the entirety of Earth’s atmosphere, including the troposphere, stratosphere, mesosphere, thermosphere, and ionosphere. By simulating the whole atmosphere within a single modeling framework, WACCM-X enables the study of coupling mechanisms between different atmospheric regions. This includes the role of atmospheric waves, which originate in the lower atmosphere, on the driving of space weather.
An important aspect of WACCM-X is the capability to constrain the model with observations through the use of data assimilation. Data assimilation statistically combines observations with a numerical model, and aims to provide a better estimate of the state of the entire atmosphere than possible from either the observations or model alone. The improved representation of the atmosphere obtained with data assimilation enables more realistic simulations of the wave driven processes that are of interest to the WAVE DRIVE Center.
WAVE uses WACCM-X as a testbed for the development of a framework to improve the representation of the impact of lower atmospheric waves on the ITM. This includes further developing the high-resolution capabilities of WACCM-X to enable explicit simulation of both small- and large-scale waves, as well as their interaction, improved parameterization of primary gravity waves, parameterization of higher-order gravity waves, and development of advanced data assimilation techniques tailored to the ITM. These developments enable the WAVE team to address important scientific questions regarding the impact of the lower atmosphere on generating ITM variability, while also providing the community with advanced Earth System Modeling capabilities.
CESM: http://www.cesm.ucar.edu/
WACCM-X: http://www.cesm.ucar.edu/models/waccm-x/
HAO WACCM-X: https://www2.hao.ucar.edu/modeling/waccm-x
References: Liu, H.-L., Bardeen, C. G., Foster, B. T., Lauritzen, P., Liu, J., Lu, G., … Wang, W. (2018). Development and validation of the Whole Atmosphere Community Climate Model with thermosphere and ionosphere extension (WACCM-X 2.0). Journal of Advances in Modeling Earth Systems, 10, 381– 402. https://doi.org/10.1002/2017MS001232
Liu, H.-L., McInerney, J. M., Santos, S., Lauritzen, P. H., Taylor, M. A., and Pedatella, N. M. (2014), Gravity waves simulated by high-resolution Whole Atmosphere Community Climate Model, Geophys. Res. Lett., 41, 9106– 9112, doi:10.1002/2014GL062468.
Pedatella, N. M., Anderson, J. L., Chen, C. H., Raeder, K., Liu, J., Liu, H.-L., & Lin, C. H. (2020). Assimilation of ionosphere observations in the Whole Atmosphere Community Climate Model with thermosphere-ionosphere eXtension (WACCMX). Journal of Geophysical Research: Space Physics, 125, e2020JA028251. https://doi.org/10.1029/2020JA028251
Huba, J. D., & Liu, H.-L. (2020). Global modeling of equatorial spread F with SAMI3/WACCM-X. Geophysical Research Letters, 47, e2020GL088258. https://doi.org/10.1029/2020GL088258
Pedatella, N. M., Liu, H.-L., Marsh, D. R., Raeder, K., Anderson, J. L., Chau, J. L., et al. (2018). Analysis and hindcast experiments of the 2009 sudden stratospheric warming in WACCMX+DART. Journal of Geophysical Research: Space Physics, 123, 3131– 3153. https://doi.org/10.1002/2017JA025107
NASA Global Modeling and Assimilation Office (GMAO) models
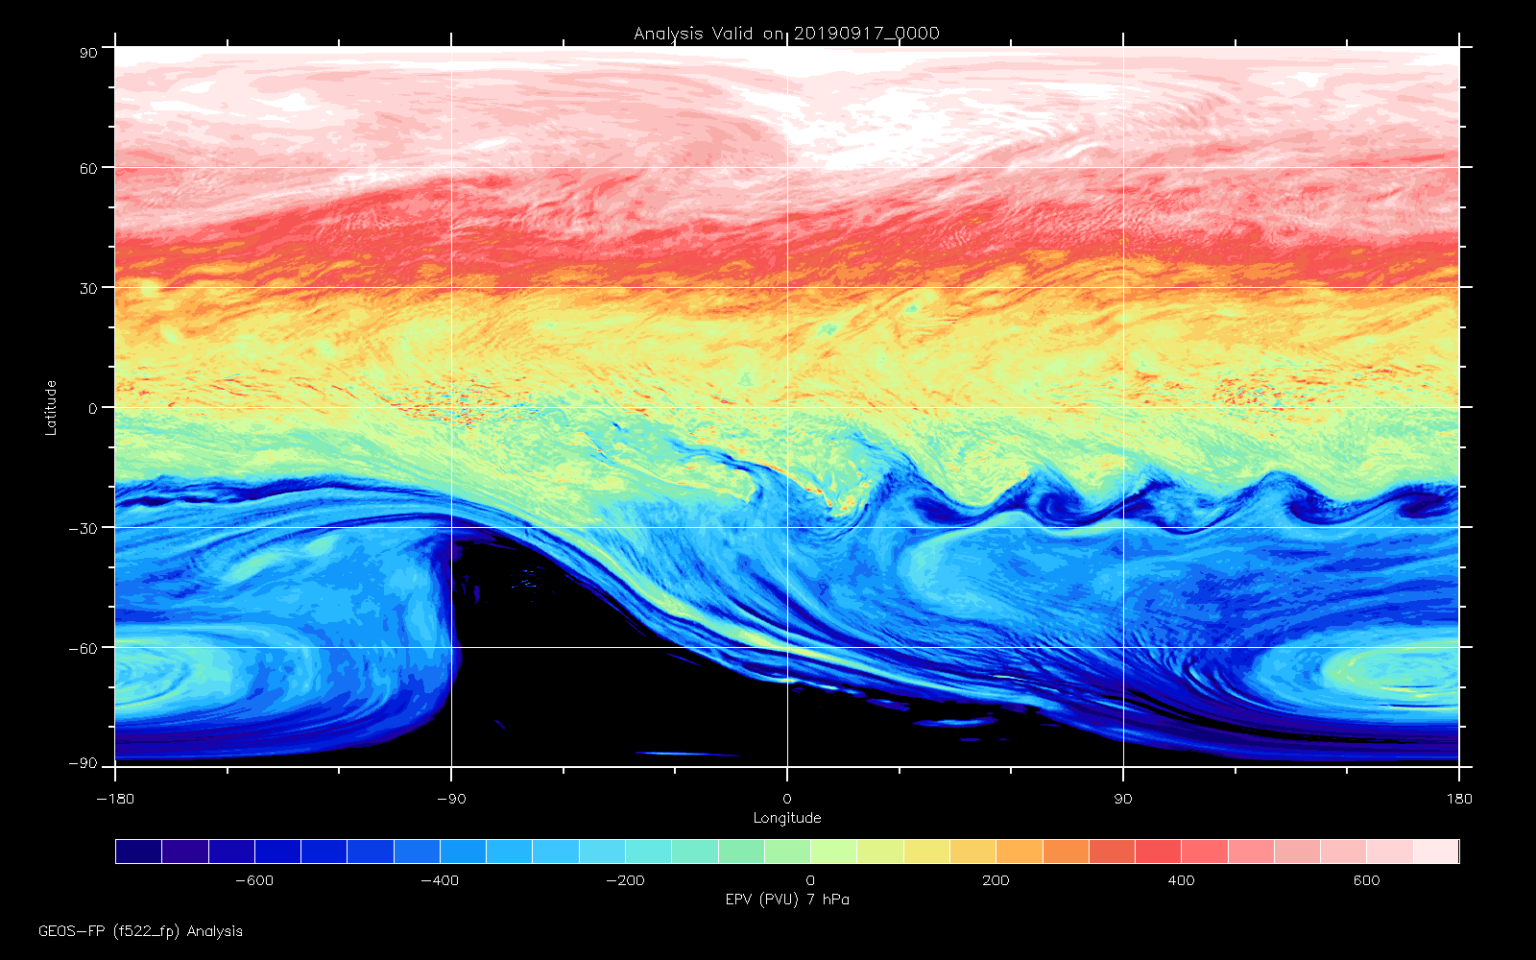
Model Description: The NASA GMAO generates a number of global model and data assimilation products that make extensive use of NASA satellite observations, provide support to satellite missions and field campaigns, and help with mission planning. In addition, these products support researchers funded by NASA and others. The GEOS (Goddard Earth Observing System) model and data assimilation system underlies various configurations including analyses and forecasts produced in real time, using the most recent validated GEOS system (GEOS-FP), a reanalysis of the period 1979 to the present (MERRA-2), and a “Nature Run” using a high-resolution version of GEOS, spanning two years (7km-G5NR). The GEOS atmospheric model component extends from the surface to approximately 80 km, with recent development focused on increasing horizontal and vertical resolution, enabling a more complete representation of the internal gravity spectrum.
See an example of waves on the Antarctic polar vortex during the spring of 2019 here:
https://gmao.gsfc.nasa.gov/research/science_snapshots/2019/stratospheric_wave_train.php
GEOS-FP Data: https://portal.nccs.nasa.gov/datashare/gmao/geos-fp/
MERRA-2 General Information: https://gmao.gsfc.nasa.gov/reanalysis/MERRA-2/
MERRA-2 Data: https://disc.sci.gsfc.nasa.gov/datasets?keywords=%22MERRA-2%22&page=1&source=Models%2FAnalyses%20MERRA-2
GMAO Nature Run General Information: https://gmao.gsfc.nasa.gov/global_mesoscale/7km-G5NR/
GMAO Nature Run Data: https://g5nr.nccs.nasa.gov/data/