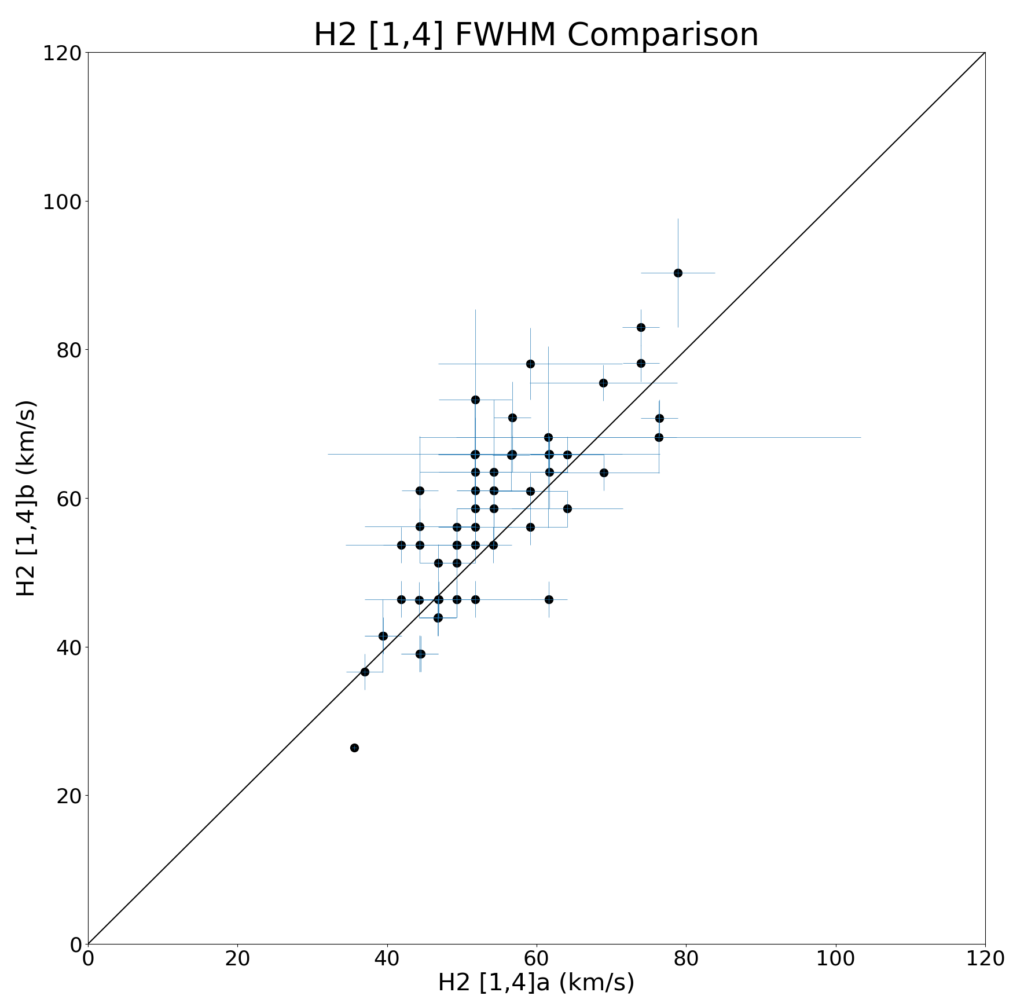
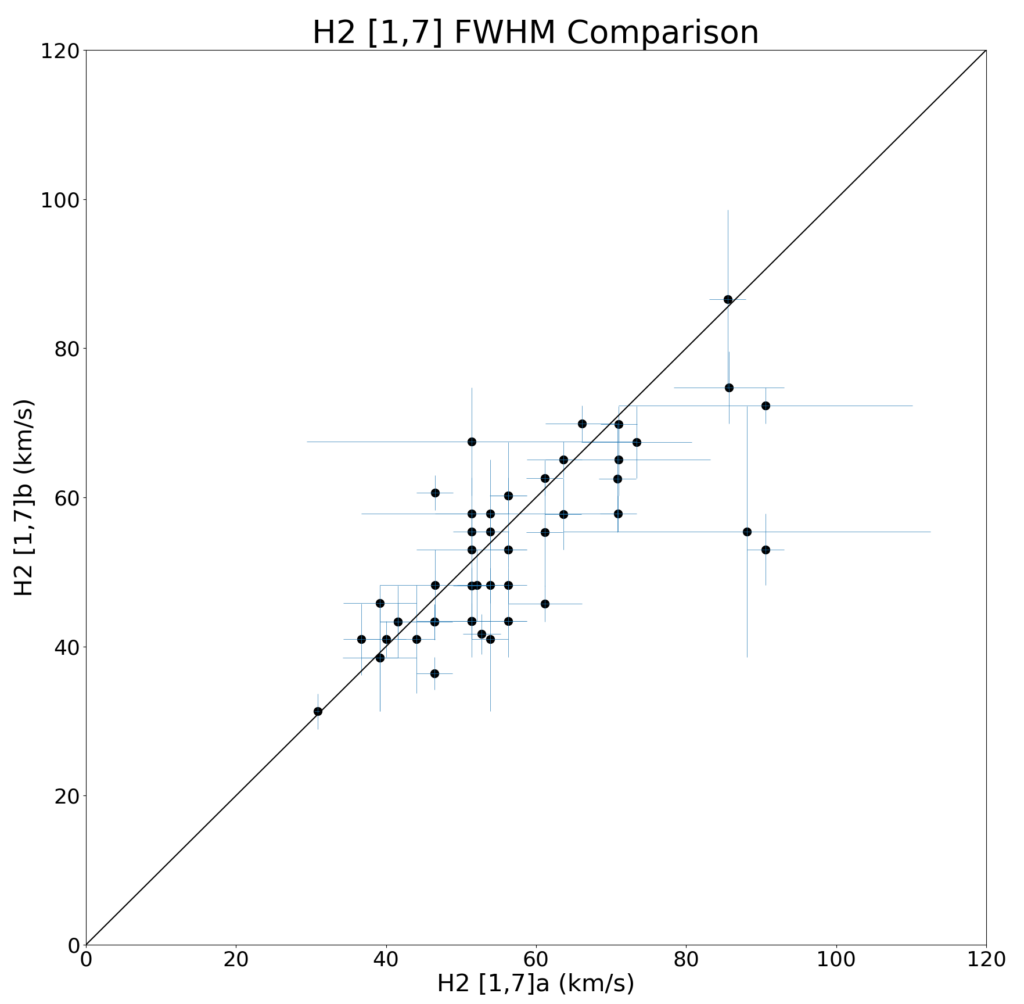
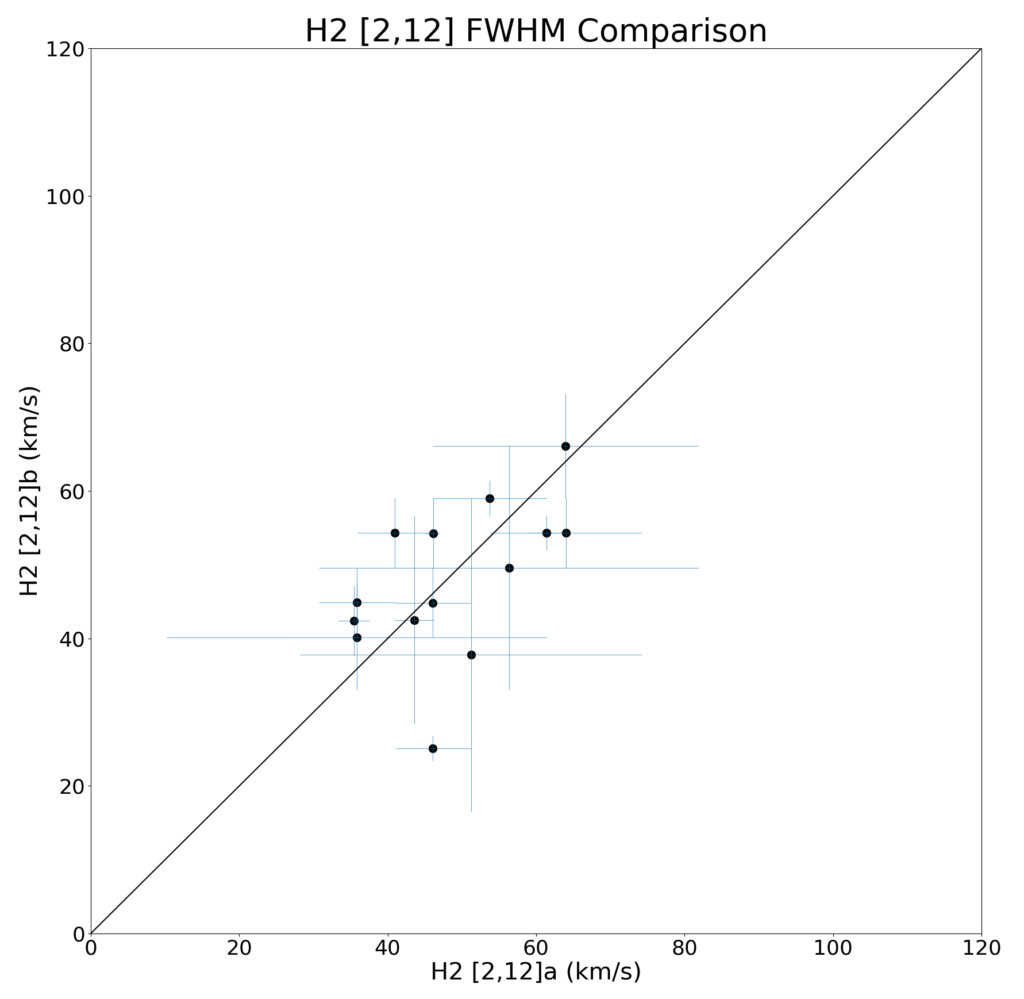
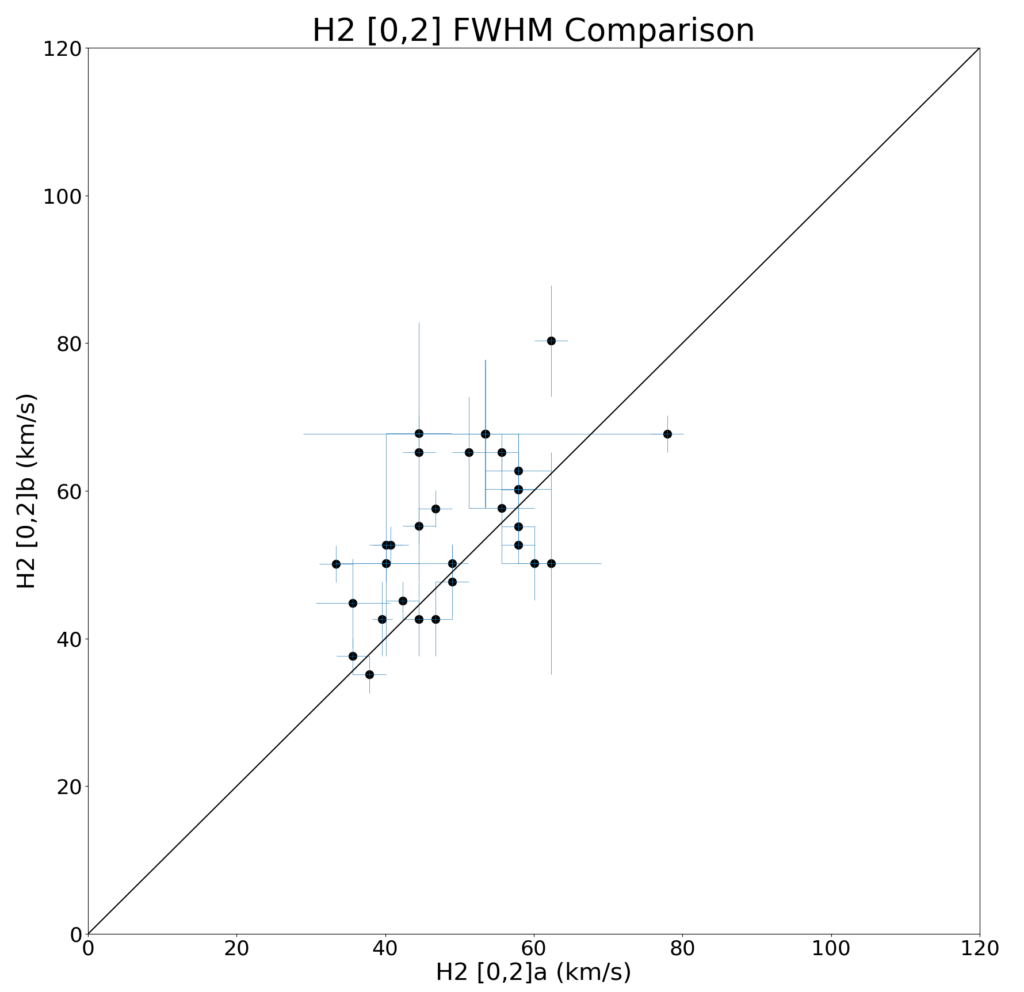
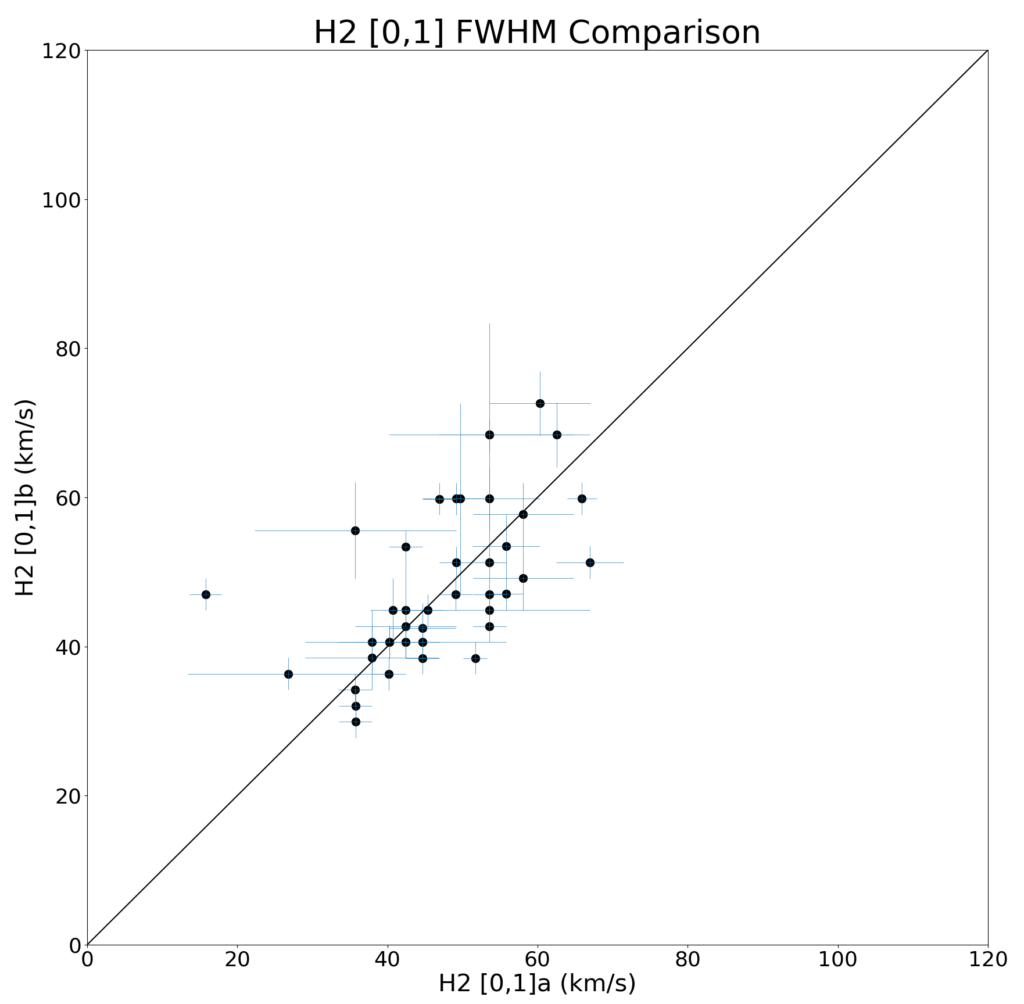
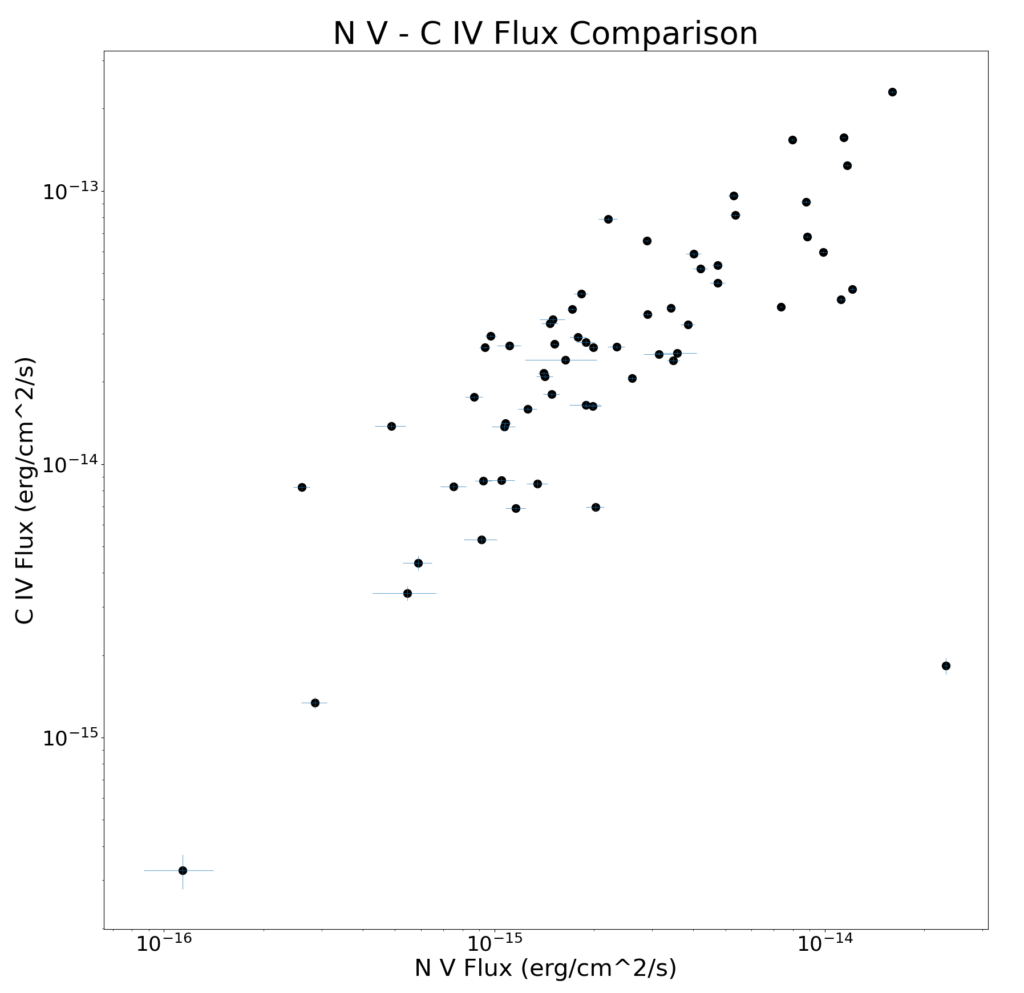
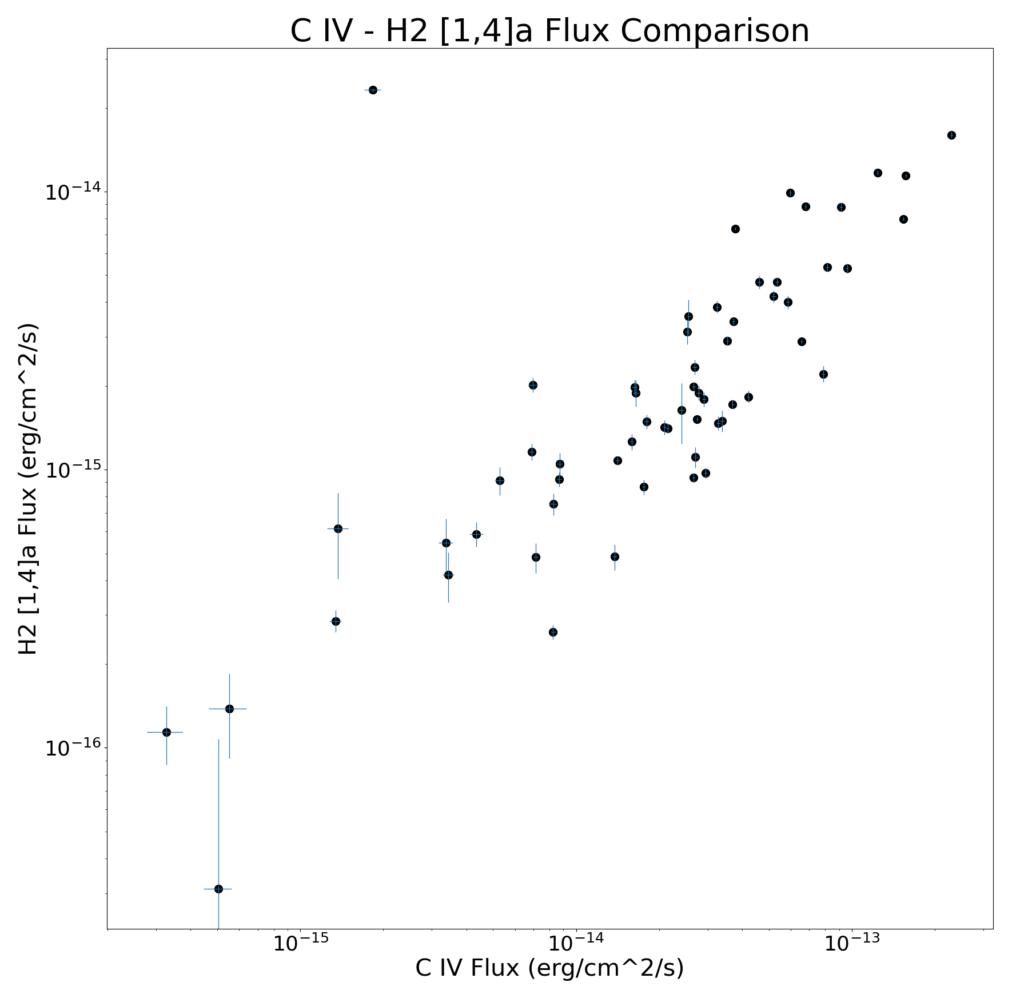
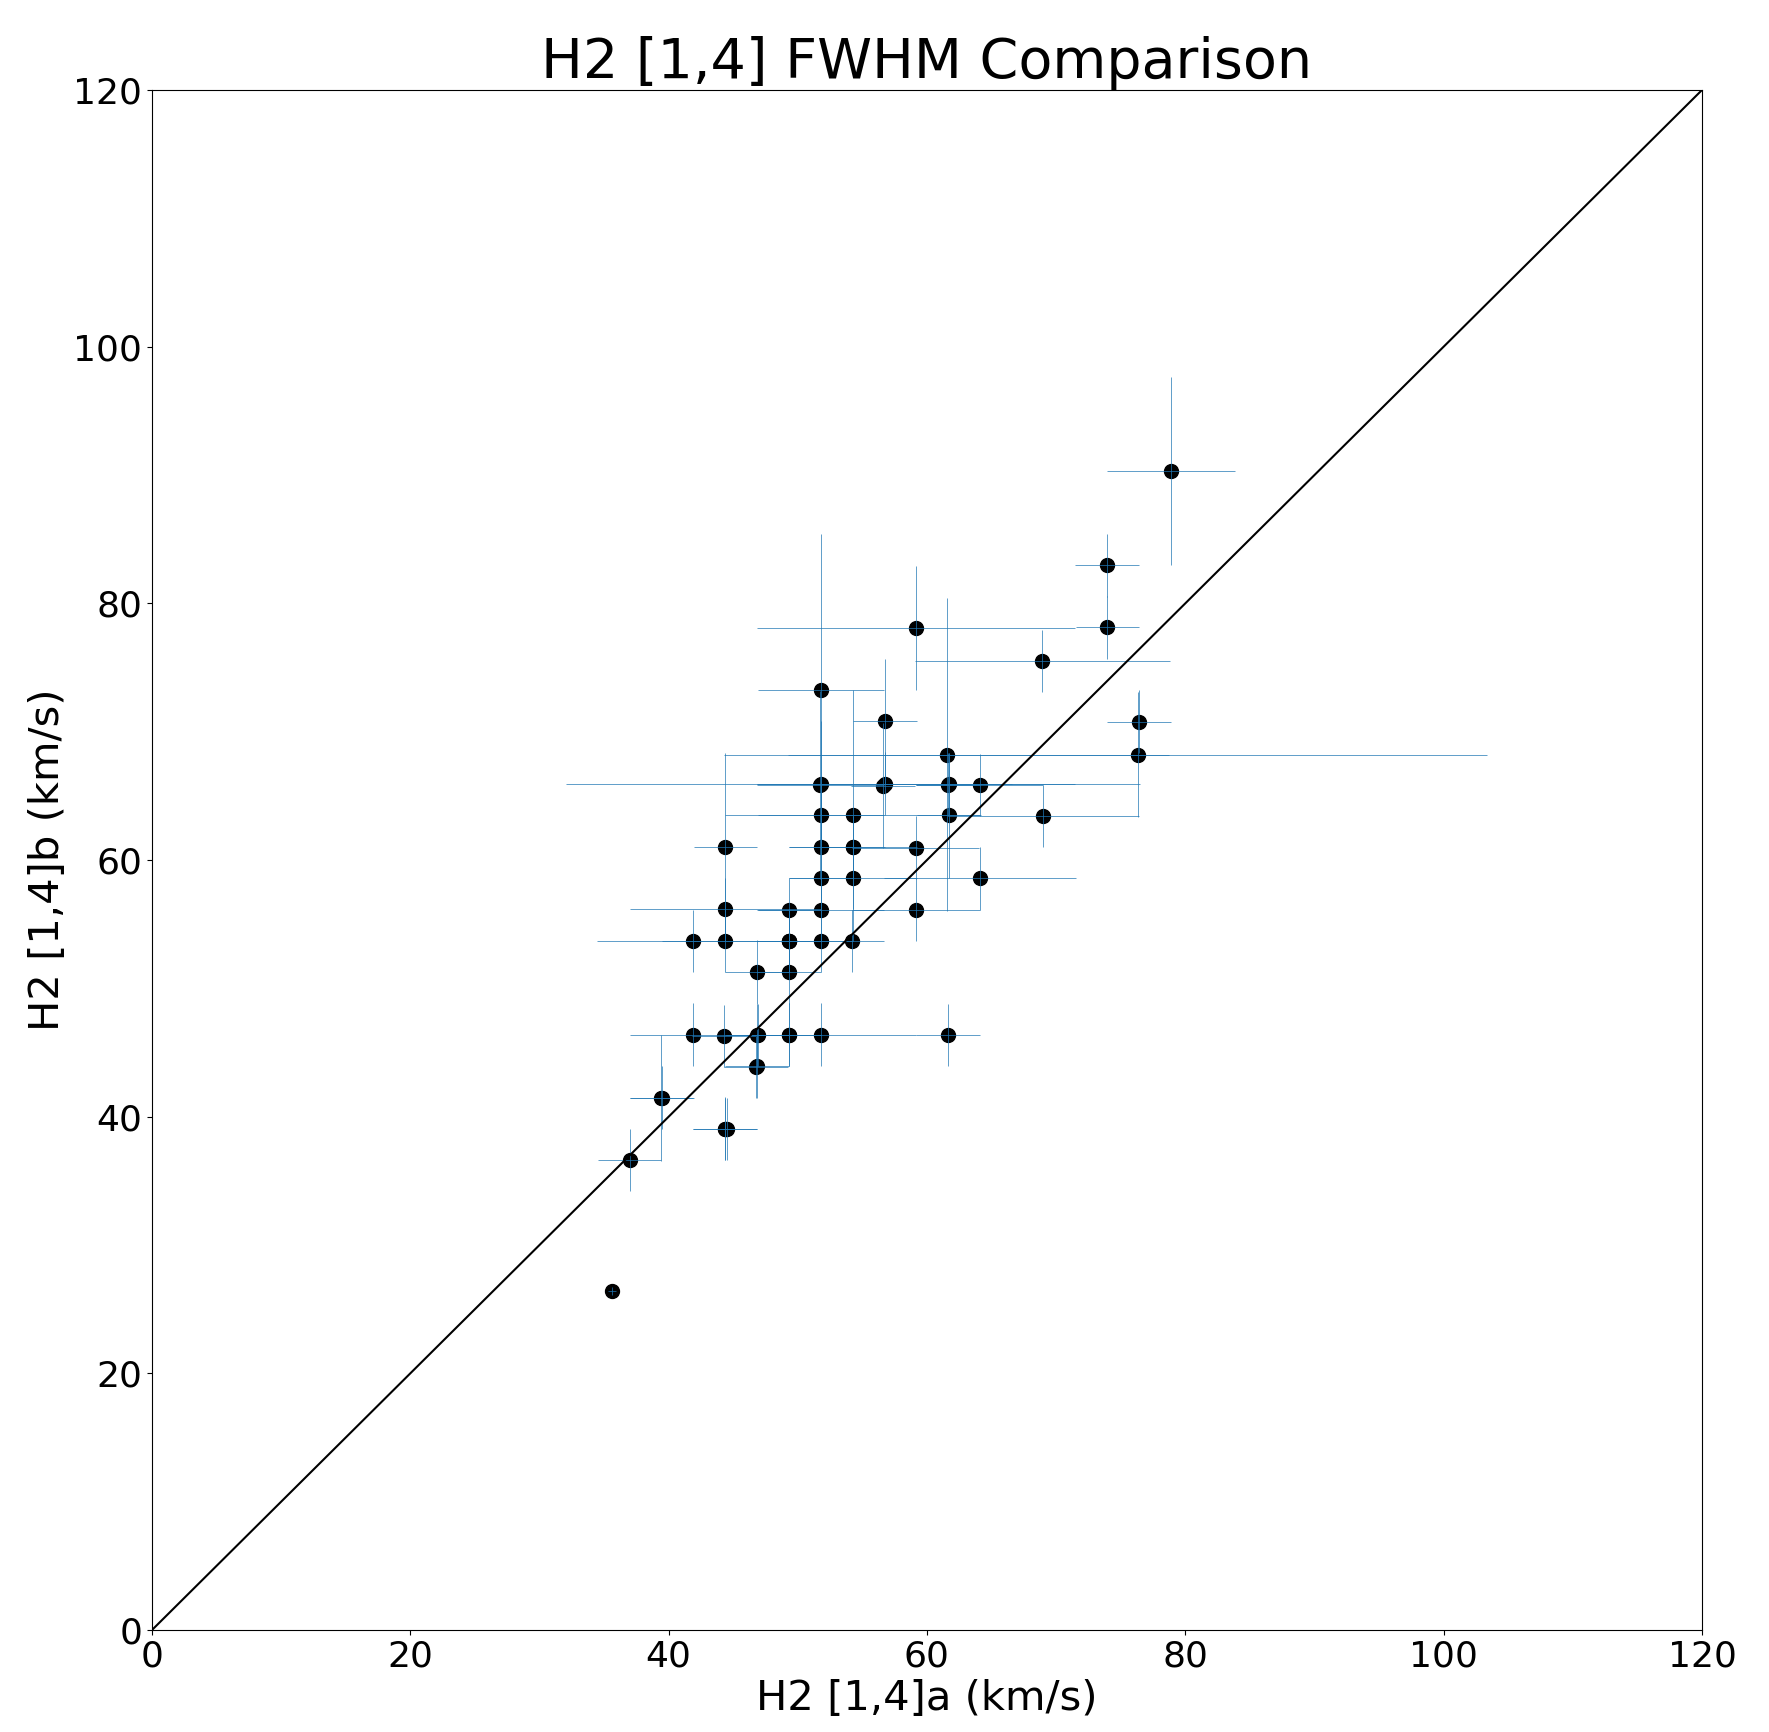
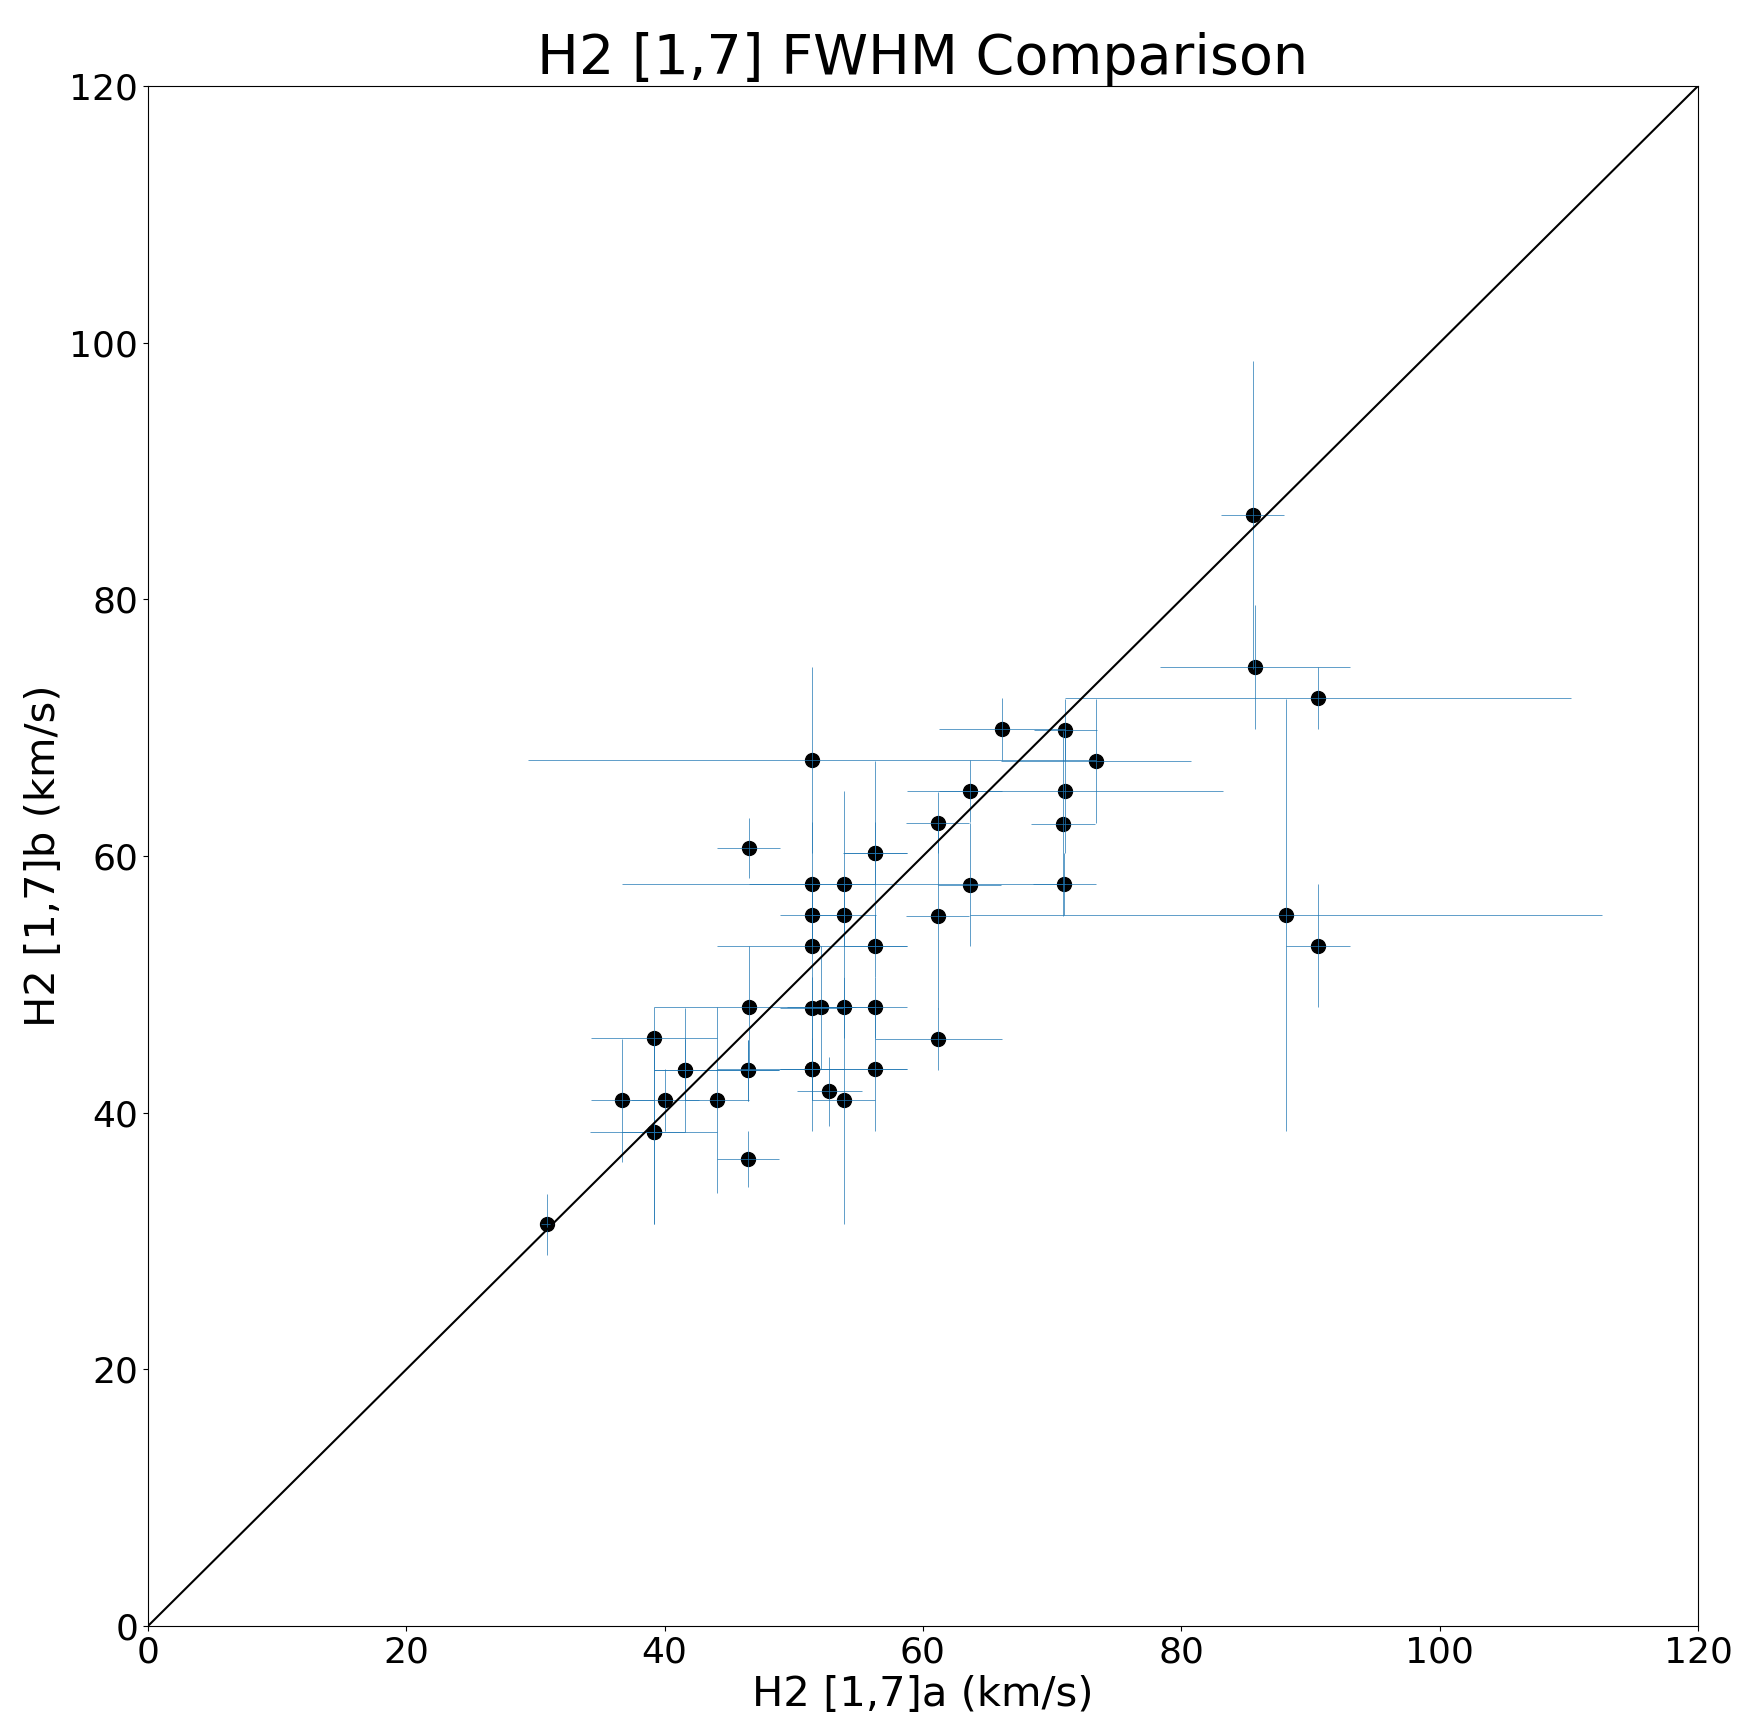
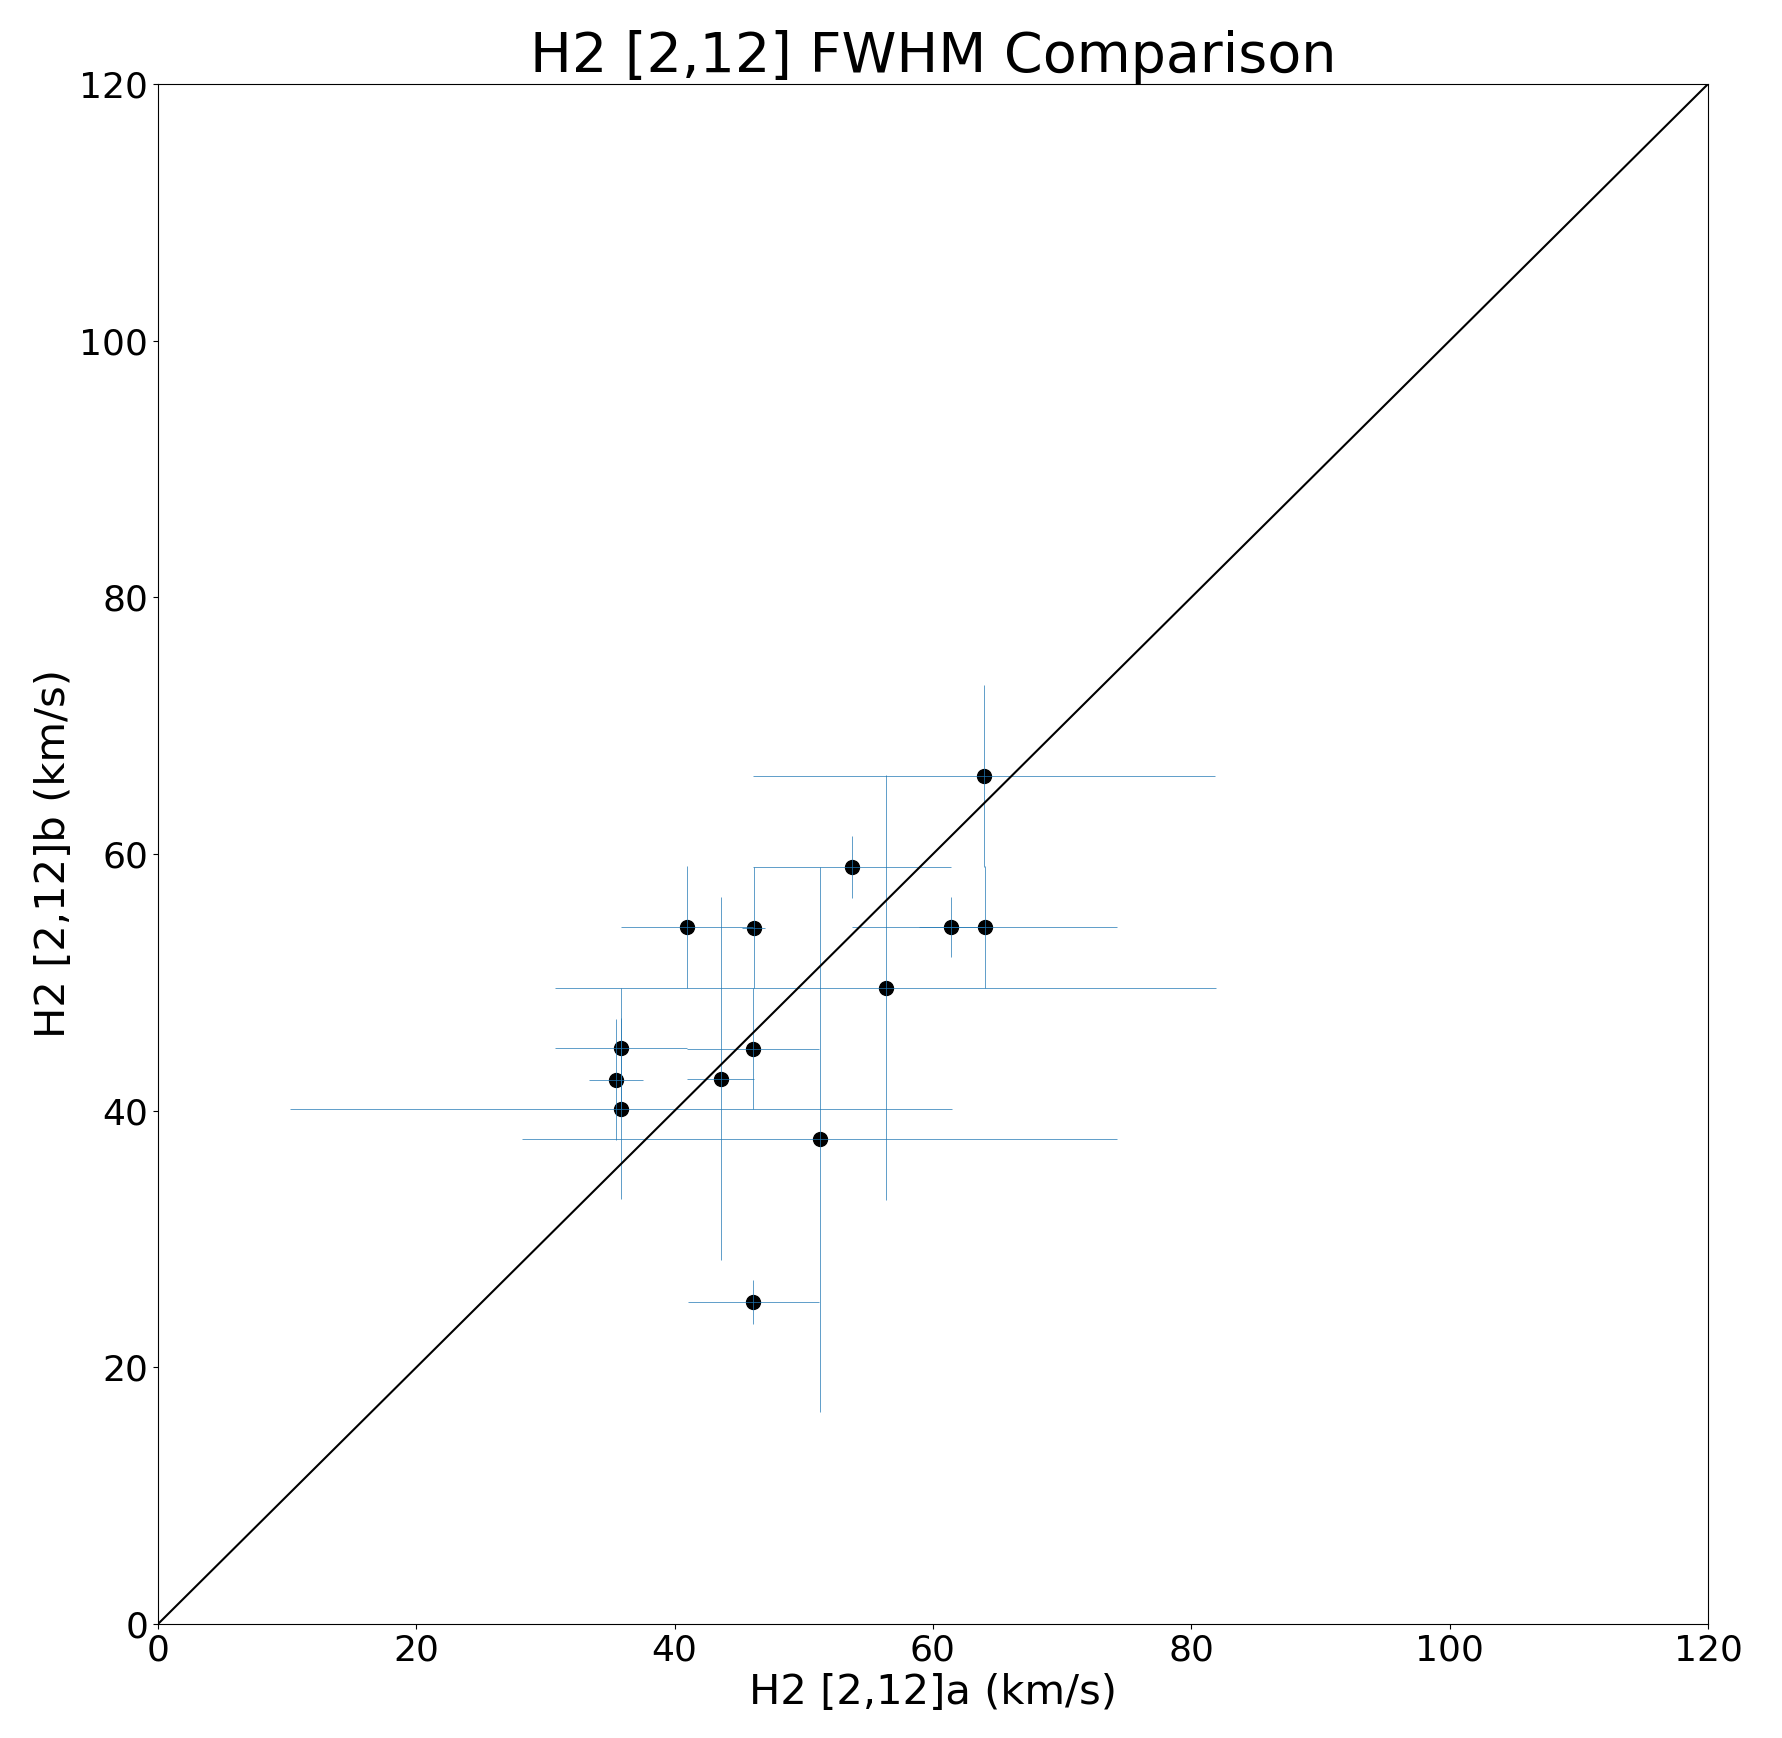
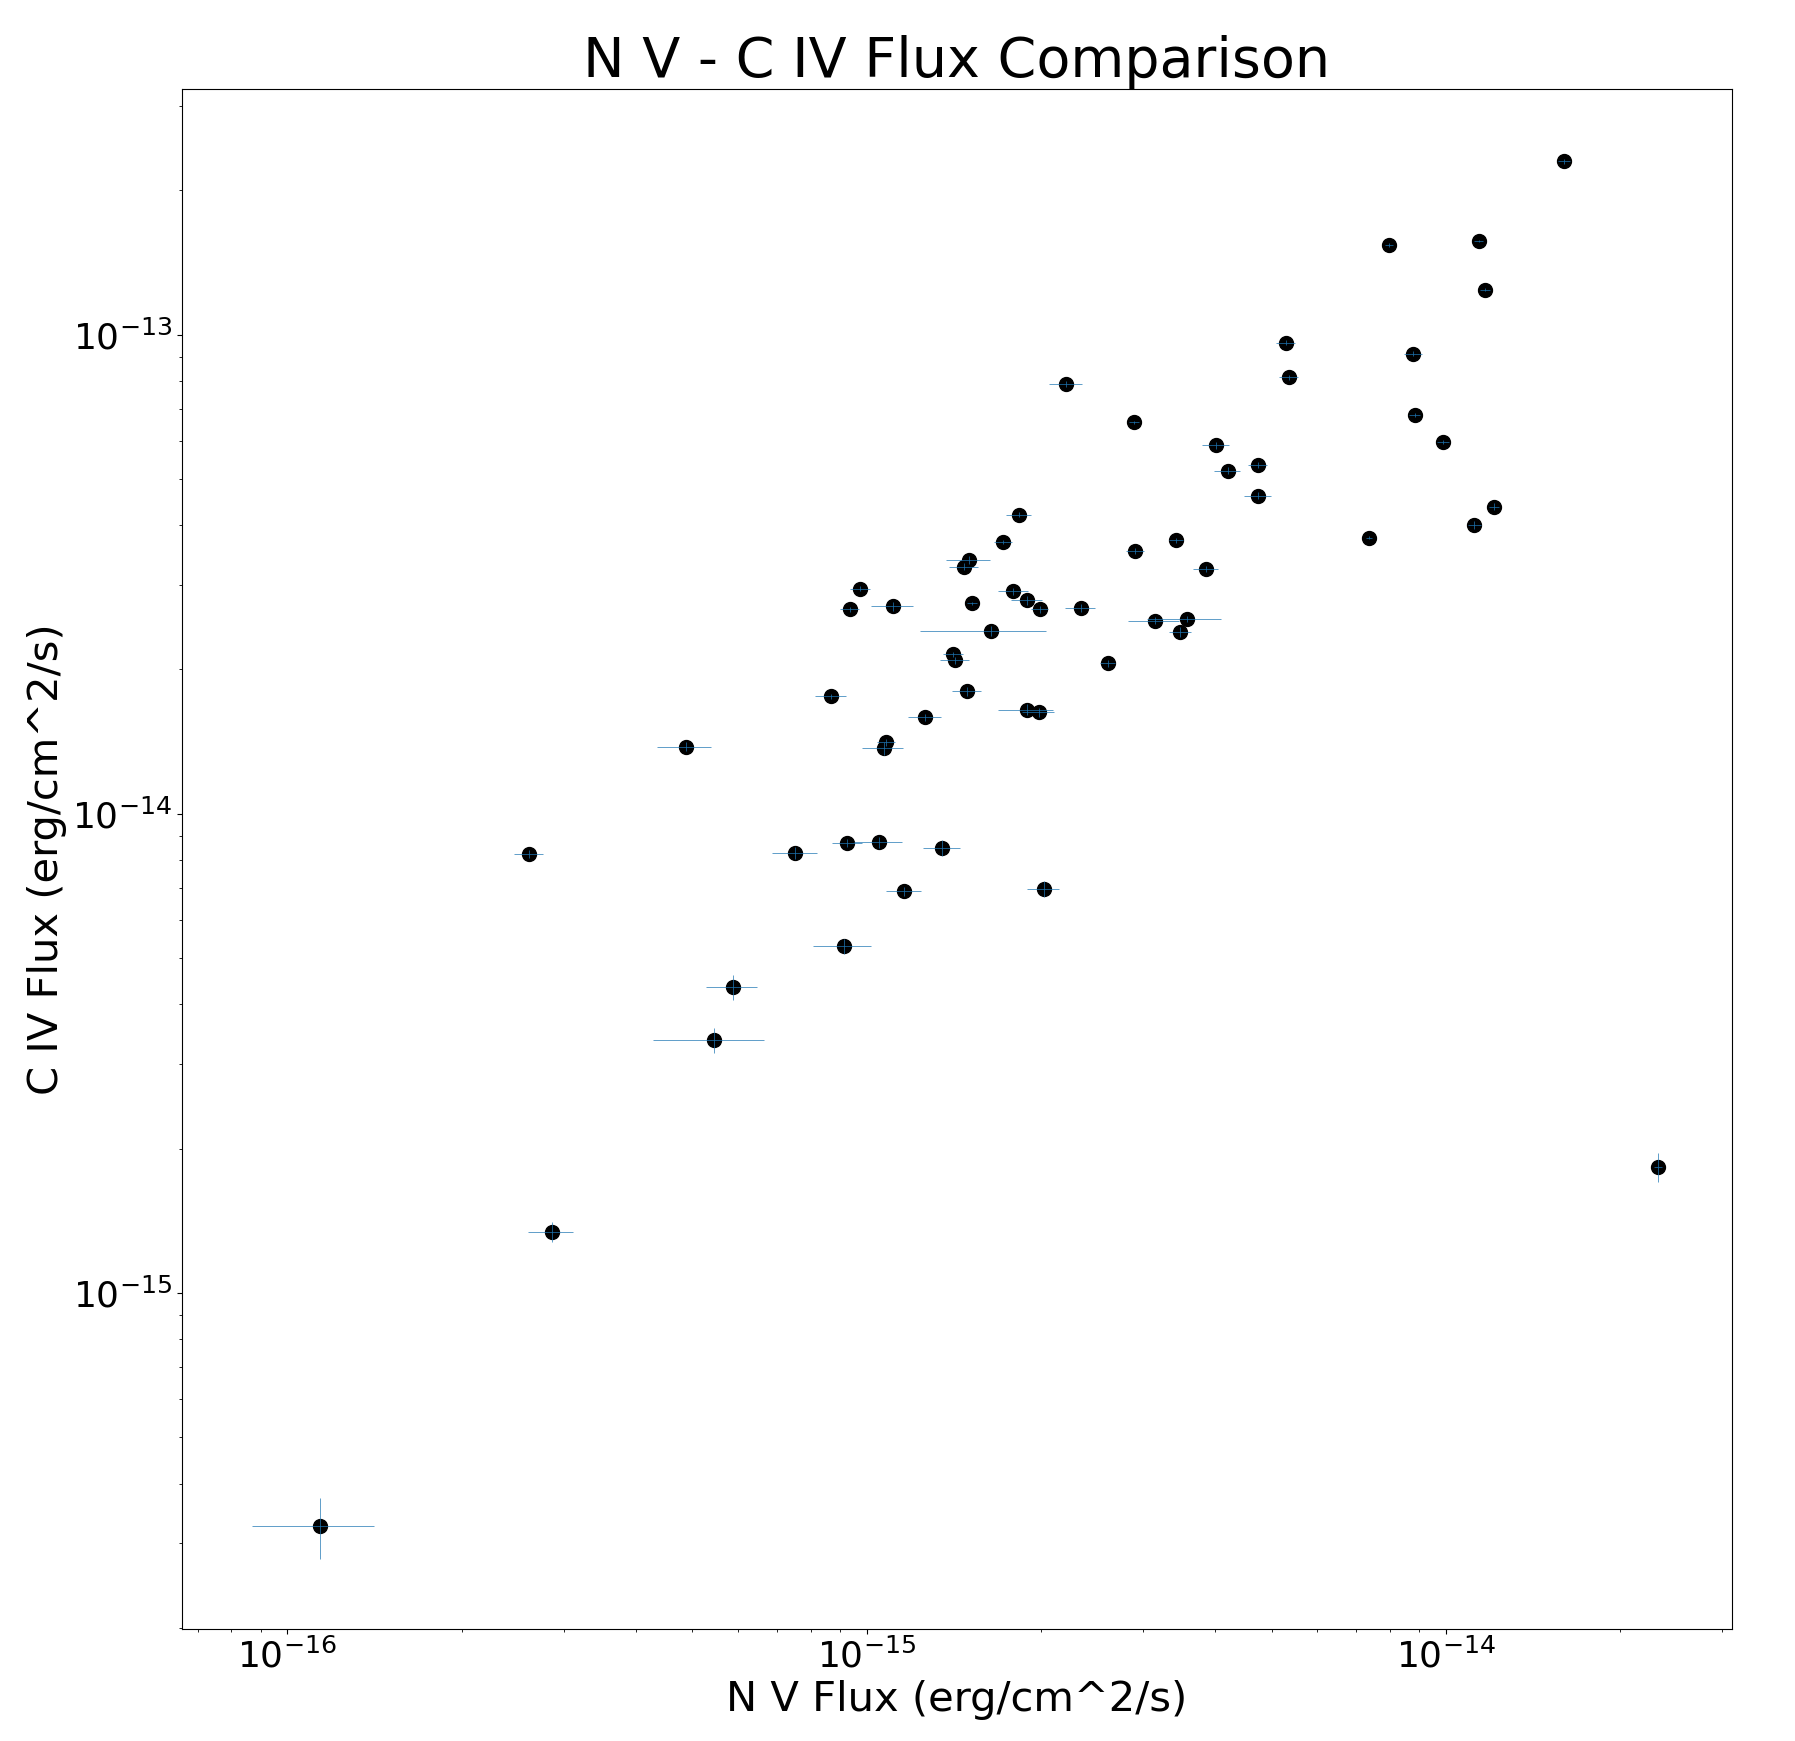
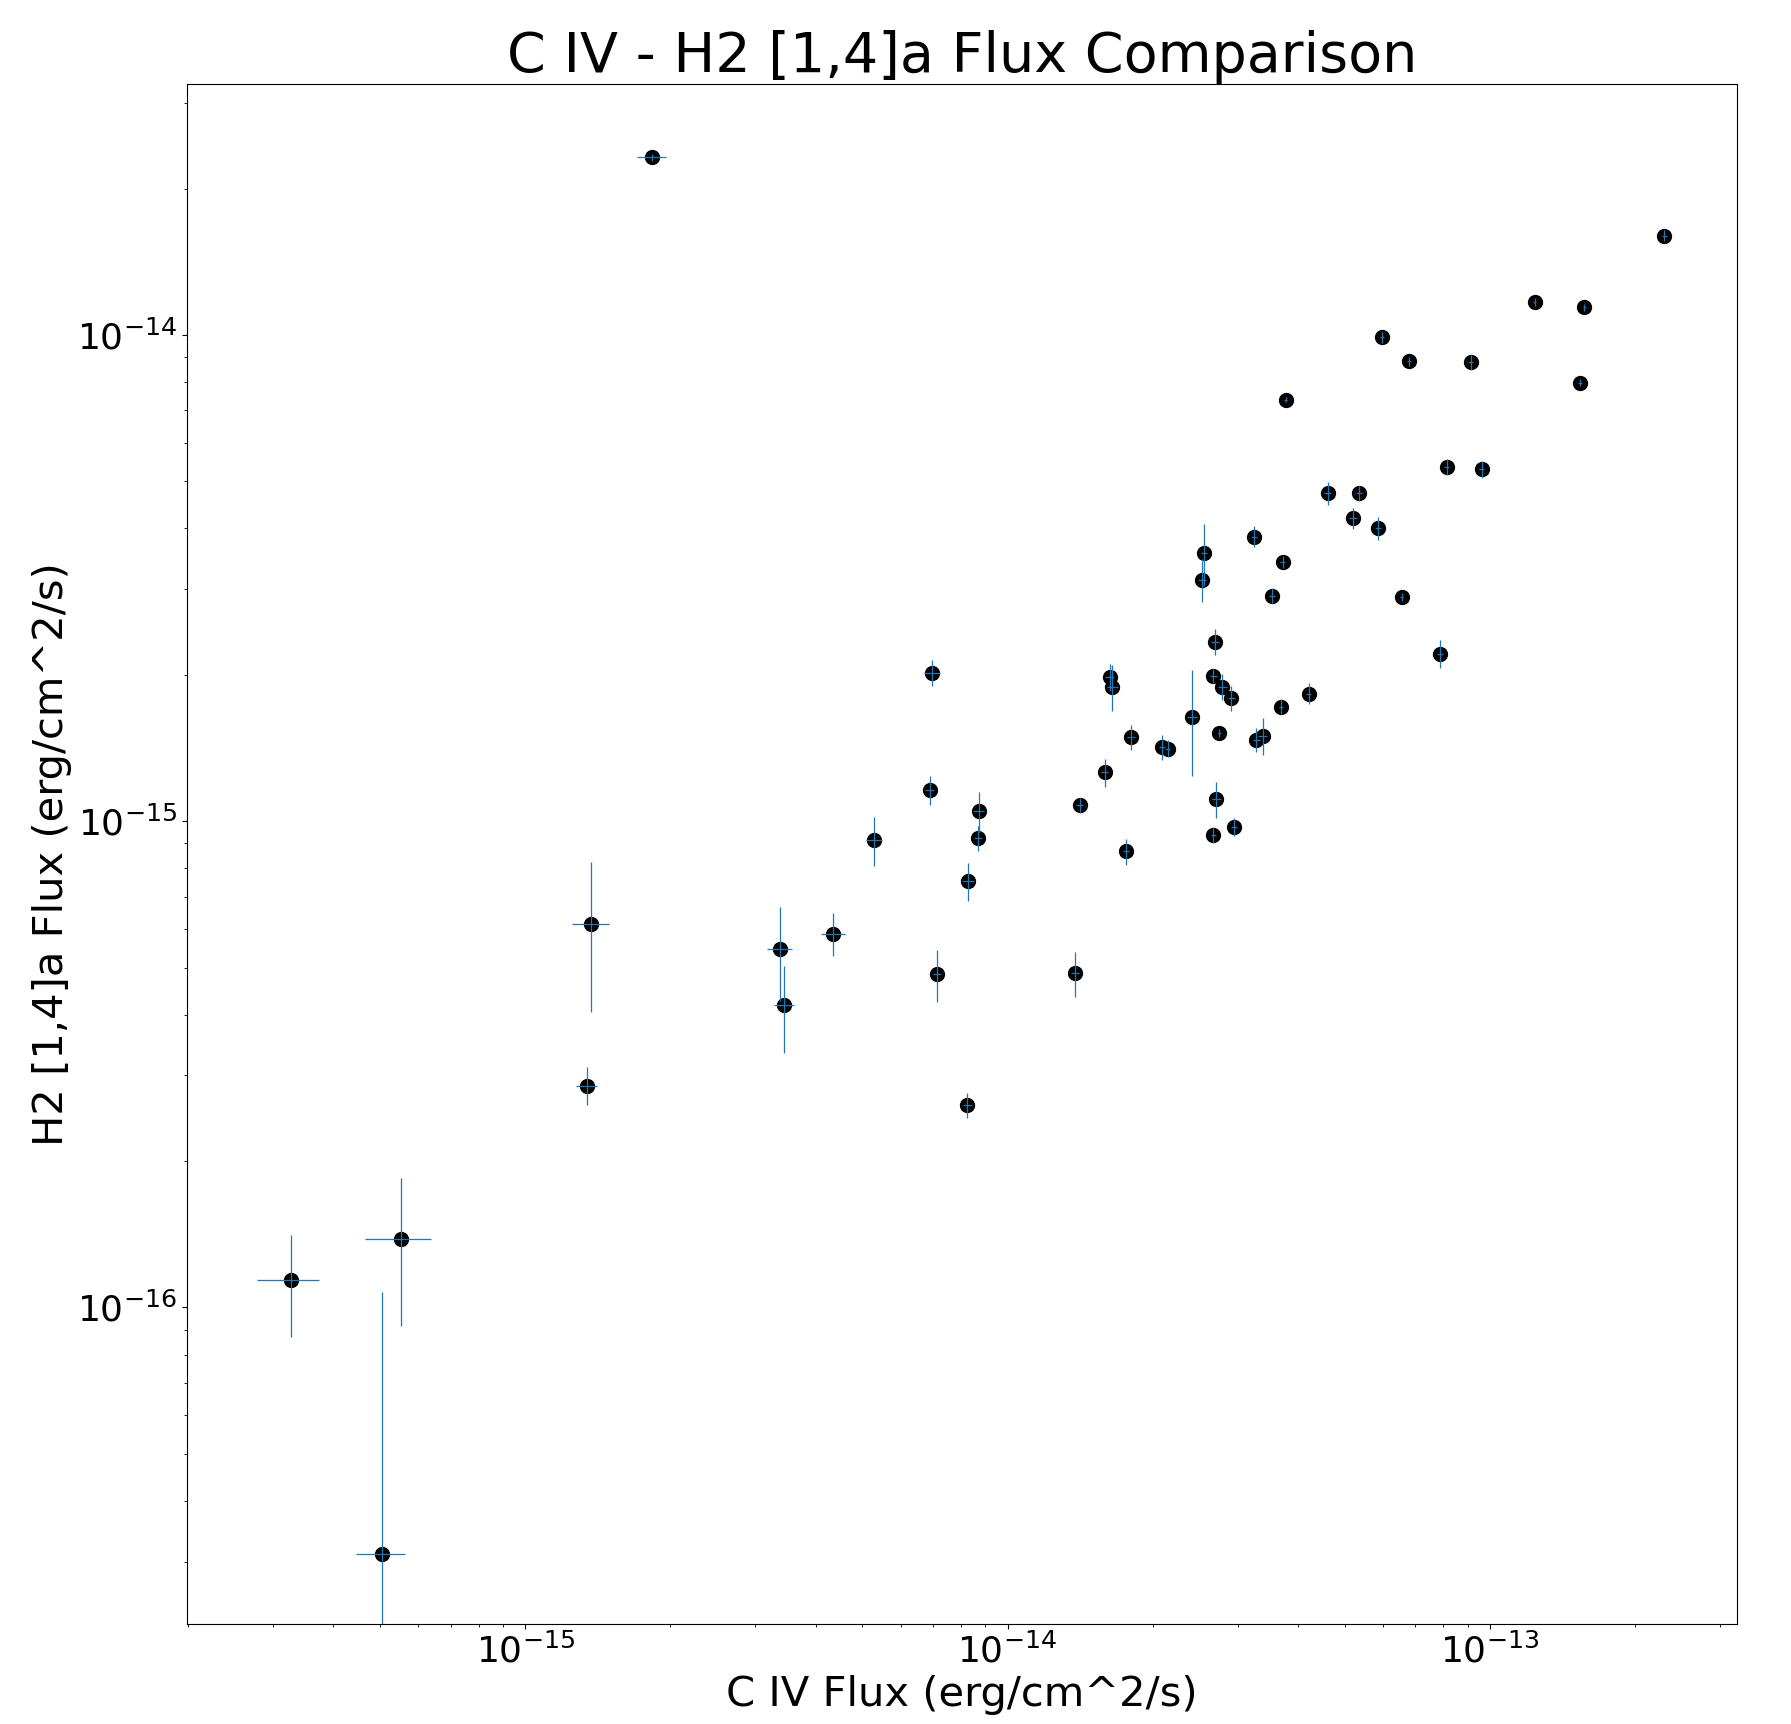
Below are the plots of FWHM and flux from a sample of prominent molecular and atomic lines. Only FWHM and flux values with low to moderate uncertainty (< 50%) are included in these overview plots. Downloadable versions of the plots are at the bottom of the page.
FWHM Plots
![](https://lasp.colorado.edu/cusp/files/2022/10/H2_14s_FWHM_plot-1024x1003.png)
![](https://lasp.colorado.edu/cusp/files/2022/10/H2_17s_FWHM_plot-1024x1004.png)
![](https://lasp.colorado.edu/cusp/files/2022/10/H2_212s_FWHM_plot-1024x999.png)
![](https://lasp.colorado.edu/cusp/files/2022/10/H2_02s_FWHM_plot-1024x992.png)
![](https://lasp.colorado.edu/cusp/files/2022/10/H2_01s_FWHM_plot-1024x1004.png)
Flux-Flux Plots
![](https://lasp.colorado.edu/cusp/files/2022/10/N5_C4_flux-flux_plot-1024x993.png)
![](https://lasp.colorado.edu/cusp/files/2022/10/C4_H214a_flux-flux_plot-1024x986.png)