
Solar Spectral Irradiance Data
- TSIS-1 SIM SSI Data Access
- Reading SSI Data Product Files
- Data Product Description
- Data QUALITY Flag (DQF) Description
- Irradiance Uncertainties Description
- Instrument Description
- TSIS-1 SIM Line Spread Function
- Data File Organization
- Scientific Contacts
- Research and Applications
- Archive of Previous TSIS-1 SIM Releases
- Release Notes
TSIS-1 SIM SSI Data Access
|
Instrument
|
Time Cadence
|
Spectral
Coverage |
Spectral
Resolution |
Level
|
Version
|
Data
Info |
Full Mission Download
|
Interactive Access
|
File Readers
(Listed by Language) |
|||||
|---|---|---|---|---|---|---|---|---|---|---|---|---|---|---|
| SIM | Daily | 200-2400nm | Varies (1-34nm) | 3 | 12 |
|
|
|||||||
| SIM | 12-Hourly | 200-2400nm | Varies (1-34nm) | 3 | 12 |
|
|
|
|
zipped text file
|
|
IDL save file
|
|
netCDF File
|
|
Interactive
|
Reading TSIS-1 SIM SSI Data Product Files
Notes for IDL users:
- The following reader is available for the zipped ASCII text files: real_lasp_ascii_file.pro (Reads SIM and TIM ASCII files)
- The following command is an example of how to read the netCDF file in IDL:
IDL> L3S=(ncdf_parse(“tsis_ssi_L3_c24h_latest.nc”,/read)).tostruct(/recursive)
Notes for Python users:
- The `xarray` package (2022.3.0) does not properly decode Julian dates (JD) into datetimes. Users should include the `decode_times=False` in the `xarray.open_dataset` call to keep the times in JD.
- When using the `netCDF4.num2date` (1.5.8) or `cftime.num2date` (1.6.0) functions to convert the time column, users should provide the flag `has_year_zero=True` to properly convert JD to datetimes.
Data Product Description
The TSIS-1 SIM instrument provides measurements of the full-disk Solar Spectral Irradiance (SSI) from 200 nm to 2400 nm with a resolution varying from 1 to 34 nm. Irradiances are reported in units of W/m2/nm at a mean solar distance of 1 astronomical unit (AU), IRRADIANCE_1AU, and at the true Earth-to-Sun distance at the time of observation, IRRADIANCE_TRUE_EARTH.
Quantities which are columns/variables in the data products are given in ALL CAPS.
Data QUALITY Flag (DQF) Description
Each TSIS-1 SIM L3 spectral irradiance measurement includes an associated bit-wise integer data quality flag (DQF) in the QUALITY data product column. A QUALITY value of 0 indicates nominal data that has no associated DQFs. If a spectral irradiance measurement has multiple DQF flags set, the values of each flag are summed to create the final QUALITY value. For example, a QUALITY value of 514 indicates back-filled data that was obtained during the HFSS-B(OFF) pointing anomaly. A table of all TSIS-1 SIM L3 DQFs is shown below.
|
Flag Value |
Data Quality Flag Name |
Description |
|
1 |
MISSING_VALUE_FLAG |
Indicates missing data items (observations). Missing data can also be identified by irradiance and uncertainty values of 0.0 (zero). Missing observations should be excluded from any data analysis |
|
2 |
FILL_VALUE_FLAG |
Indicates data items that have been backfilled from previous measurements within one day. |
|
512 |
BAD_HFSSB_POINTING |
Indicates irradiance measurements for which a wavelength-dependent correction was applied to account for the HFSS-B(OFF) pointing anomaly that affected data obtained from 19 March to 19 May 2022 |
TSIS-1 SIM L3 data quality flags (DQFs). Note that a QUALITY value of 0 indicates that no DQF is associated with a particular spectral irradiance measurement and that data should be considered nominal. Data with a QUALITY of 512 has a slighter higher irradiance uncertainty due to the uncertainty of the spectral correction that has been applied. (see ADDITIONAL_UNCERTAINTY below).
Please feel free to contact the TSIS science team (see below) if you have any questions or concerns regarding the quality or usage of the TSIS data.
Irradiance Uncertainties Description
Four types of uncertainties are reported in the TSIS-1 SIM L3 Data Release, these are:
INSTRUMENT_UNCERTAINTY (W/m2/nm) is a pre-launch measure of instrument spectral irradiance uncertainty with contributions from component, and unit-level, instrument laboratory characterizations, and calibrations with the final end-to-end full spectrum validation of the measured irradiances against a NIST-traceable cryogenic radiometer performed in LASP’s Spectral Radiometer Facility. Reported uncertainties represent an upper limit to the irradiance accuracy for each wavelength.
MEASUREMENT_PRECISION (W/m2/nm) is a wavelength-dependent measure of the on-orbit variance in the scan-to-scan repeatability of the observed spectral irradiances during solar minimum. MEASUREMENT_PRECISION is wavelength dependent, but not time dependent.
MEASUREMENT_STABILITY (W/m2/nm) is a relative metric of the on-orbit degradation correction uncertainties. It has contributions from uncertainties due to the post-processing of data (including instrument degradation correction) and differences between the observed irradiances of the three separate SIM channels. Measurement stability is given as 0.0 at wavelengths > 1845 nm, where the degradation corrections are currently not calculated, and for all data that arrives after the last bi-annual Channel-C calibration scans. The bi-annual Channel-C scans trigger a new data release version, so generally, there will be at least six months of measurement stability values that are 0.0 until they are determined during the creation of the next data release.
ADDITIONAL_UNCERTAINTY (W/m2/nm) is a composite irradiance uncertainty pertaining to anomalous periods and the associated corrections in the data record, indicated by the QUALITY data column. This uncertainty is applied to data where, due to atypical circumstances, the data have a higher uncertainty than nominal measurements.
Notes:
- Beginning with the V08 release, MEASUREMENT_PRECISION is no longer a term in the MEASUREMENT_STABILITY uncertainty.
- The ADDITIONAL_UNCERTAINTY column/variable was added in V09.
- V10 extends prism degradation corrections longward of 1050 nm to 1845 nm. MEASUREMENT_STABILITY uncertainties in this bandpass now include degradation uncertainty estimates.
- As of V12 the only type of ADDITIONAL_UNCERTAINTY is related to the HFSS-B(OFF) pointing anomaly in March-May of 2022 (QUALITY=512). Channel and wavelength-specific spectral corrections were needed during this period that introduced an additional irradiance uncertainty.
- For V11, the MEASUREMENT_STABILITY uncertainties reported after 20 Jan. 2023, and before the April 2023 ChC scans, were derived using the outdated V10 degradation models, and not the piece-wise linear degradations. The actual MEASUREMENT_STABILITY values reported during these time periods are likely to be slight underestimates.
For deriving a TSIS-1 SIM absolute irradiance uncertainties, it is recommended that users add in quadrature all four uncertainty values. For a relative irradiance uncertainty, reflecting the uncertainty in the irradiances between two time periods, use MEASUREMENT_PRECISION, MEASUREMENT_STABILITY, and ADDITIONAL_UNCERTAINTY, added in quadrature.
Instrument Description
For a complete description of the SIM instrument, please visit the instrument home page:
SIM Overview
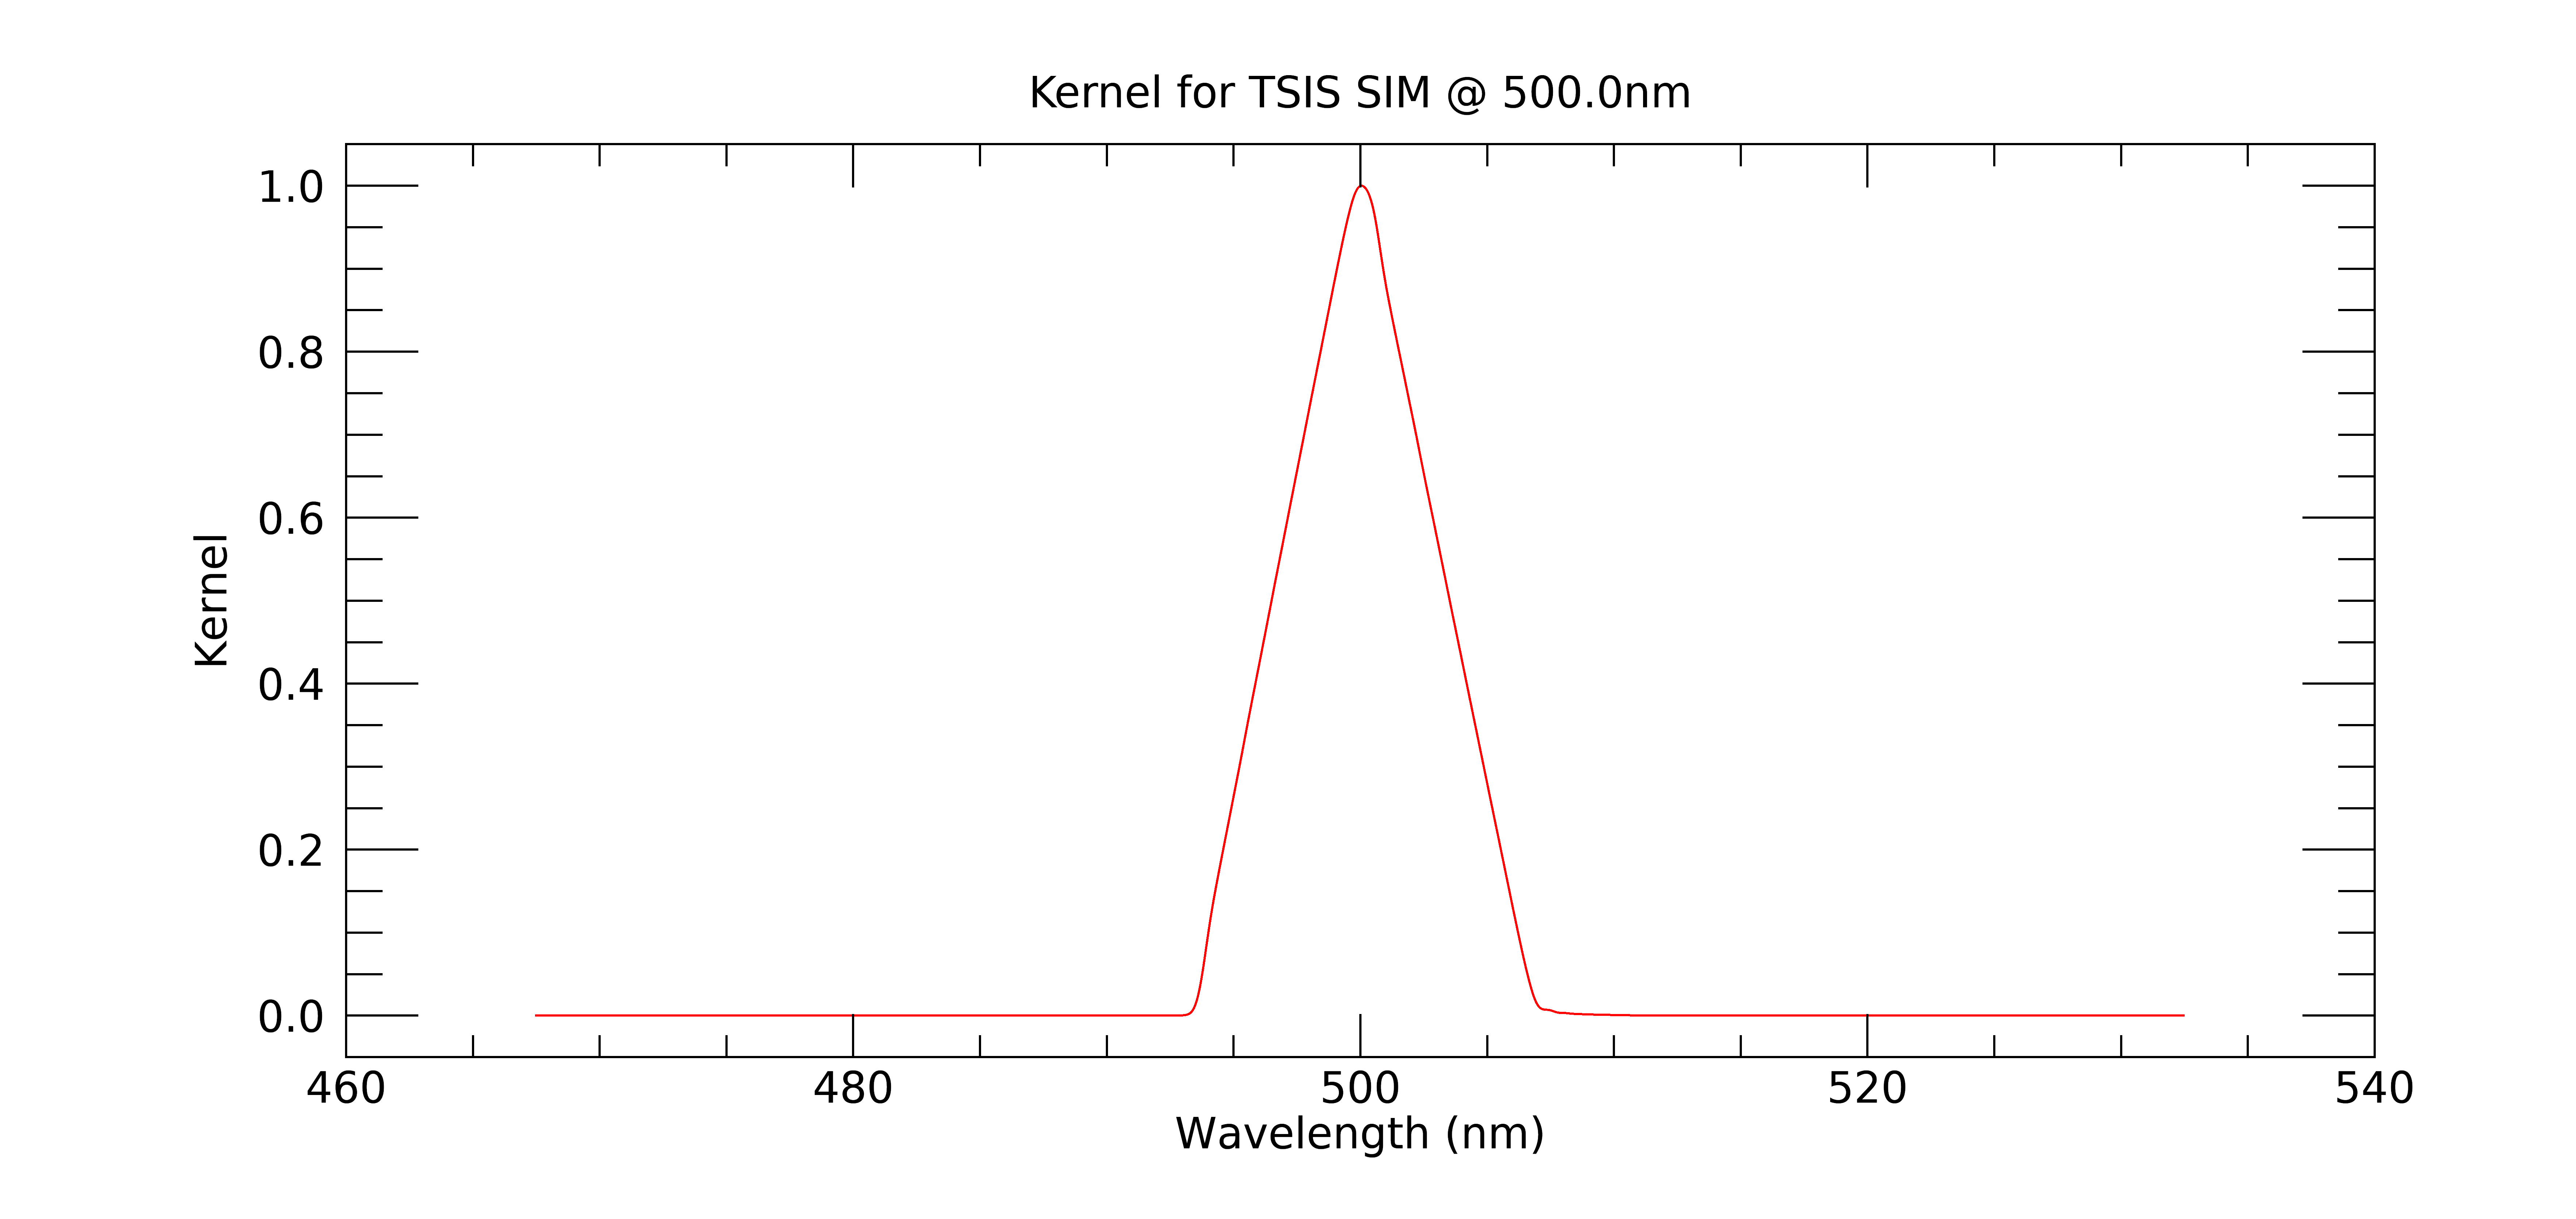
Instrument Line Spread Function
The Line-Spread-Function profiles were derived from the instrument measurement equation obtained through extensive ground calibration. The LSF varies as a function of wavelength (due to the prism as the dispersing optical element) and is sampled at 0.1 nm from 200 to 2400 nm. A sampling of 0.01 nm was necessary from 310.0 to 310.1 nm to better fit the transition between the UV and VIS detectors.
Note: A problem with the data was discovered for wavelengths shorter than 210.0 nm in V01. This issue was fixed in V02 available on this page.
The LSF data is provided below as an IDL save file and as a netCDF file.
The data structure is organized by central wavelength and corresponds to the 2000 elements kernel around this wavelength. The corresponding wavelengths for each of these kernels are provided as a set of linear fit coefficients (2 elements) with the starting wavelength and the incremental wavelength for each bin (in nm).
- CENTRAL_WAVELENGTH array of 22001 elements
- WAVELENGTH_COEFFS 2-dimensional array of 22001 x 2 elements
- KERNEL 2-dimensional array of 22001 x 2000 elements
The Kernels were calculated separately for each detector with different wavelength coverage:
UV: 200.0 to 311.4 nm
VIS: 311.4 to 950.0 nm
IR: 950.0 to 1620.0 nm
ESR: 1620.0 to 2400.0nm
Note that the exit slit on the UV detector is larger than the other detectors resulting in a wider Kernel compared to the other detectors/wavelengths. The kernels are normalized so that the peak value is equal to 1.0. When convolving the LSF, the user has to scale by the integral to preserve the flux. We provide example IDL-code demonstrating the use of the LSF dataset.
Example in pseudo-code:
To obtain the Line Spread Function at 500.0 nm
index=3000
CENTRAL_WAVELENGTH[index] = 500.0
kernel_500 = KERNEL[index, *]
coeffs = WAVELENGTH_COEFFS[index,*]
waves = array[2000] with values 0.0, 1.0, 2.0, 3.0, ..., 1999.0
kernel_waves = coeffs[0] + waves * coeffs[1]
plot,kernel_waves, kernel_500
Scientific Contacts
Dr. Erik Richard
Research Associate, LASP/CU (303) 735-6629
Email: (use firstname.lastname@lasp.colorado.edu)
Research and Applications
Because of selective absorption and scattering processes in the Earth’s atmosphere, different regions of the solar spectrum affect Earth’s climate in distinct ways. Approximately 20-25% of the Total Solar Irradiance (TSI) is absorbed by atmospheric water vapor, clouds, and ozone, by processes that are strongly wavelength-dependent. Ultraviolet radiation at wavelengths below 300 nm is completely absorbed by the Earth’s atmosphere and contributes to the dominant energy source in the stratosphere and thermosphere, establishing the upper atmosphere’s temperature, structure, composition, and dynamics. Even small variations in the Sun’s radiation at these short wavelengths will lead to corresponding changes in atmospheric chemistry. Radiation at the longer visible and infrared wavelengths penetrates into the lower atmosphere, where the portion not reflected is partitioned between the troposphere and the Earth’s surface, and becomes a dominant term in the global energy balance and an essential determinant of atmospheric stability and convection.
Archive of Previous TSIS-1 SIM Releases
- TSIS-1 SIM V06 covering 14 March 2018, through 22 Nov. 2021
- TSIS-1 SIM V07 covering 14 March 2018, through 18 March 2022
- TSIS-1 SIM V08 covering 14 March 2018, through 11 November 2022
- TSIS-1 SIM V09 covering 14 March 2018, through 15 April 2023
-
TSIS-1 SIM V10 covering 14 March 2018, through 05 March 2023
-
TSIS-1 SIM V11 covering 14 March 2018, through 24 Jan 2024