
Science
Science
A summary of the SIM instrument’s properties is provided below, and is described in detail in the text.
| SIM Properties | |
| Instrument Type | Dual Fèry Prism Spectrometer |
| Wavelength Range | 310-2400 primary, 200-300 secondary |
| Wavelength Resolution | 0.25-33 nm |
| Optics | Suprasil 300 prism |
| Detectors | ESR, n-on-p and p-on-n silicon, InGaAs (5 detectors) |
| Absolute Accuracy | 2% |
| Long-term Accuracy | 0.03%/year |
| Field of View | 1.7° x 2.5° (half power points) |
| Dimensions (H×W×D) | 25.4 × 17.8 × 76.2 cm |
| Mass | 22 kg |
| Orbit Average Power | 25.3 W @ 28 V |
| Peak Power | 35.4 W @ 25 V |
| Orbit Average Data Rate | 1.6 kbytes command, 0.65 mbytes |
| Redundancy | 2 redundant spectrometers |
| Heritage | New Design |
| Pre-flight Cal. Std. | Component unit level test + NIST cryogenic radiometer |
| In-flight Cal. | Prism transmission cal + redundant channel comparison |
The SIM instrument is making the first continuous record of the solar spectral irradiance in the visible/near infrared region of the spectrum at the top of the Earth’s atmosphere. To date, the time history of spectral irradiance variability in this part of the spectrum is not nearly as complete as the total solar irradiance and the solar ultraviolet radiation records.
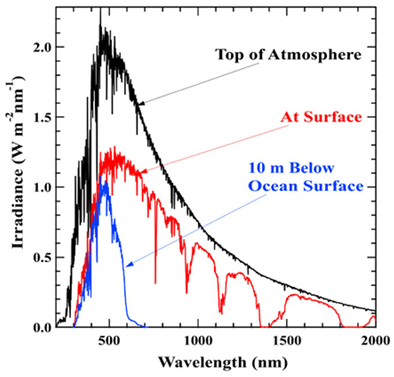
Absorption of solar radiation at the top of the atmosphere, at the Earth (click image to enlarge)
Measurements of spectral irradiance in the visible/near infrared spectral region are important because absorption of solar radiation in the atmosphere, on land surfaces, and in ocean water is strongly wavelength dependent. Therefore, an understanding of solar variability as a function of wavelength is important to climate studies.
Solar variability models, with the additional constraint of Total Solar Irradiance (TSI) observations, predict very small fractional changes on the order of 0.1-0.01% in the solar output over the visible/near infrared spectral range so the instrument requires very high precision.

Fractional 11-year solar cycle graph (click image to enlarge)
The graph to the left shows the fractional 11-year solar cycle variability as a function of wavelength over much of SIM’s measurement band pass. The y-axis of the graph is logarithmic between 104 and 100, and linear below that value. For most wavelengths, the light intensity increases at solar max, but in the infrared, especially in the neighborhood of the 1.6 µm H- opacity region, the variability is very small and is out of phase with the solar cycle. The graph also shows the spectral regions of importance to the Earth climate system. Solar variability in the 174 to 300 nm spectral region is critical to both the dynamics and chemistry of ozone in the middle atmosphere (L. L. Hood, 1999). However, visible and infrared radiation penetrates deeper into the Earth’s atmosphere and therefore contributes an important component to solar forcing of climate.
The fractional variability in the visible/near infrared region is on the order of 0.1%, but in terms of energy flux the visible spectrum varies by about 1.3 W/m2. This is greater than the more variable UV spectrum by an order of magnitude. SIM detects changes in the 27-day solar rotation period, which is greater than or equal to the solar cycle change.