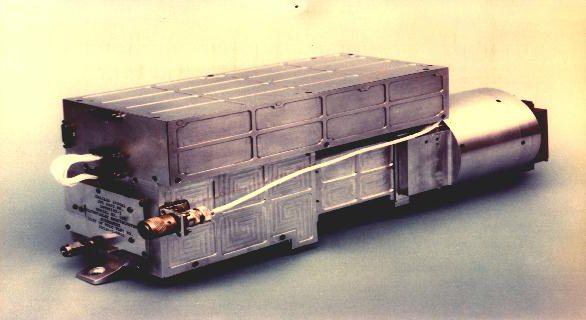
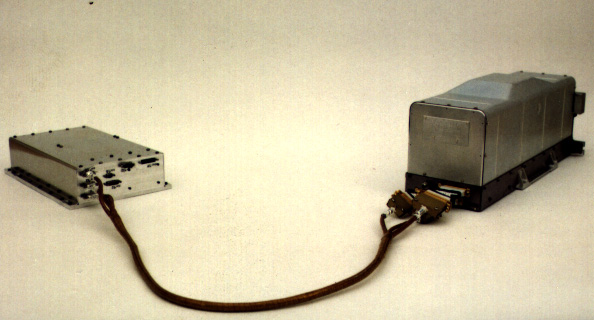
Galileo entered Jupiter orbit on December 7, 1995. The LASP experiment consisted of two instruments, an ultraviolet spectrometer (UVS) mounted on the orbiter scan platform, and the extreme ultraviolet spectrometer (EUV) mounted on the spinning section of the spacecraft. The UVS has three detectors: the F-channel covers 162.0 to 323.1 nm in first order with a CsTe photocathode, the N-channel covers 282.0 to 432.0 nm in first order with a KCsSB photocathode, and the G-channel covers 113.3 to 192.1 nm in second order with a CsI photocathode. The F-channel field of view is 0.1 x 0.4 deg while the G and N-channels use a 0.1 x 1.0 deg field of view. With these two instruments the teams goal was to investigate the Io plasma torus, the upper atmosphere of Jupiter, and the volatile gases escaping from Galilean satellites.
Launched October 18, 1989 from the Space Shuttle, the Galileo spacecraft made several inner solar system gravity assist passes around Venus and the Earth (2) before heading out toward Jupiter. Along it’s Jupiter path it observed the asteroids Gaspra and Ida, observed the Shoemaker-Levy “string of pearl” fragments entering Jupiter’s atmospheric clouds and released the Probe for it’s descent into Jupiter’s atmosphere. Both the UVS and EUV instruments participated in many of these observations.
Each instrument had an RCA 1802 CMOS radiation hardened microprocessor which controlled instrument science data taking and engineering operations as well as buffer(s) for data storage and transfer to the CDS (Command and Data Subsystem). The microprocessor software, written at LASP, changed several times for each instrument, especially to accommodate onboard data summation, a method to compress data rate, following the failure of the high gain antenna to deploy.
The original software versions for each instrument, referred to as Phase 1 software, accommodated full wavelength resolution as well as several modes of “mini-scan” (UVS) and “sky-sector” (EUV) selectability. Later, the full wavelength modes, without selectability, were available for very limited recorded, maximum resolution observations for both UVS and EUV. Cruise and Phase 2 software modes were implemented in both instruments by employing an onboard buffer to sum data over varying time periods. The time periods were enabled through various LRS (Low Rate Science) telemetry modes that forced data transfer from the instrument buffer to a CDS buffer and on to the telemetry stream, either recorded or downlinked in real time. The CDS contained the summation buffer for UVS, EUV memory contained its summation buffer. These telemetry modes executed an automatic “memory flush” at time integrals specified by the telemetry mode. The three periods are 29 RIMS, 59 RIMS, and 1 RIM less than 24 hours. In each case, one RIM is used to transfer and clear the buffer. Flush events result in a separate record of an observation data file. Included in the flush records are words that describe the length of the integration period as well as time tags and a few critical commanded control values. These are detailed in the Instrument templates and in useful descriptions below.
Each instrument was commanded by a command with several parameters. The science command for the UVS changed operational parameters between Phase 1 and Phase 2. For EUV in Phase 1 there was a large matrix buffer to sum each wavelength by each Sector as well as a buffer to sum all wavelengths by Sector (Sector Integration Buffer or SIB) and a buffer to sum all sectors by wavelength (WIB). The EUV science command remained the same in Phase 2 however wavelength and sector summing in a smaller matrix was controlled by the upload to the instrument memory of a Fixed Pattern Noise Table (FPNT). In Phase 2 there were three FPNTs whose wavelength tables selected certain wavelengths for maximum spectral resolution while summing other background wavelengths. The three tables were for use on EUV observations of the Aurora, Torus or General observations and were loaded, generally, by the executing sequence. The command archive (cmd_archive.lis) and other sequence summary descriptions indicate which FPNT was being used. Both instruments increased their internal summation buffers from byte length to two-byte integer values to accommodate counting rates for the available summation periods. During EUV “All Sky” mapping in late orbits some wavelengths would roll over the two-byte buffer but there is sufficient timing knowledge to interpret the values. Software is available for this purpose.