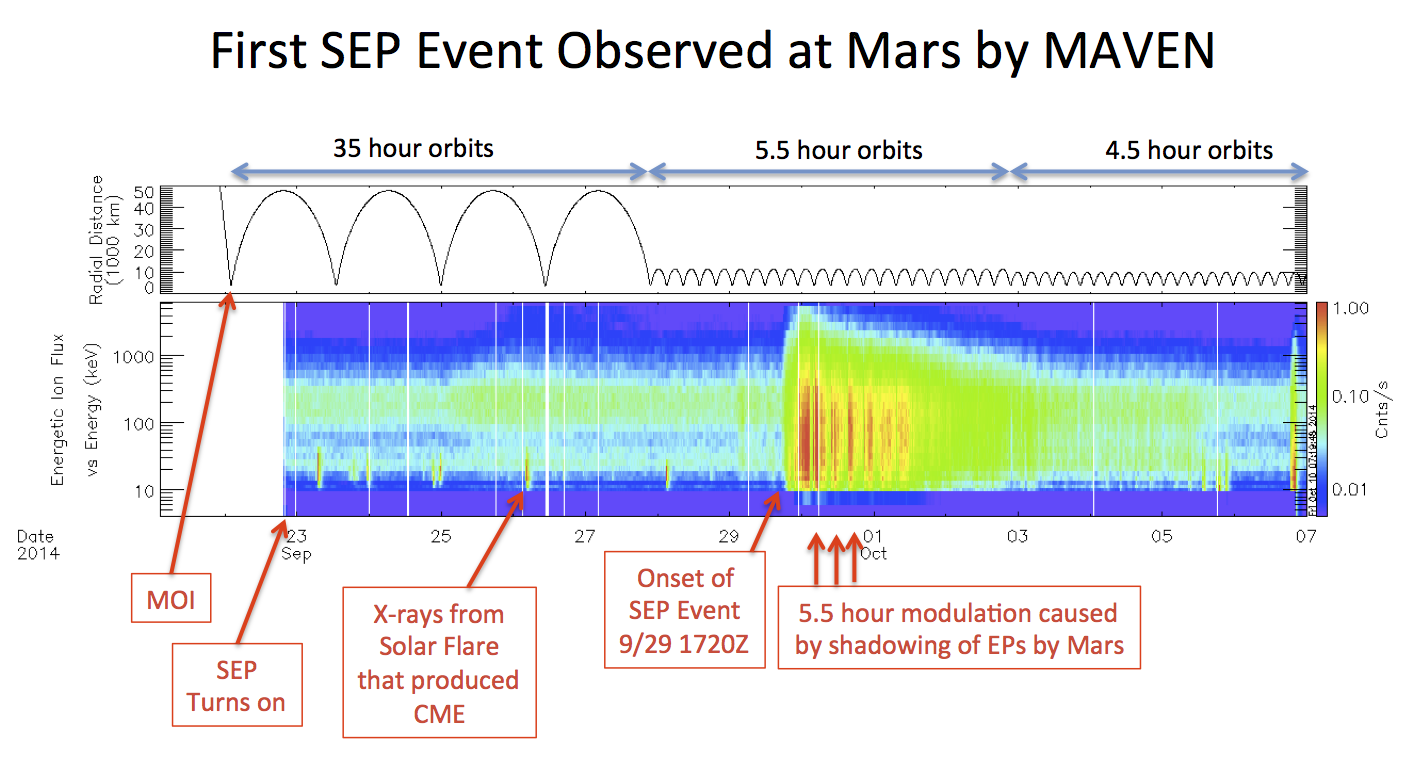
This image shows the sequence of events leading up to the first SEP event observed by MAVEN at Mars. The top panel shows the distance between MAVEN and Mars as a function of time. The bottom panel shows Energetic Ion Flux as a function of particle energy (vertical axis) and time (horizontal axis). (Courtesy Davin Larson)